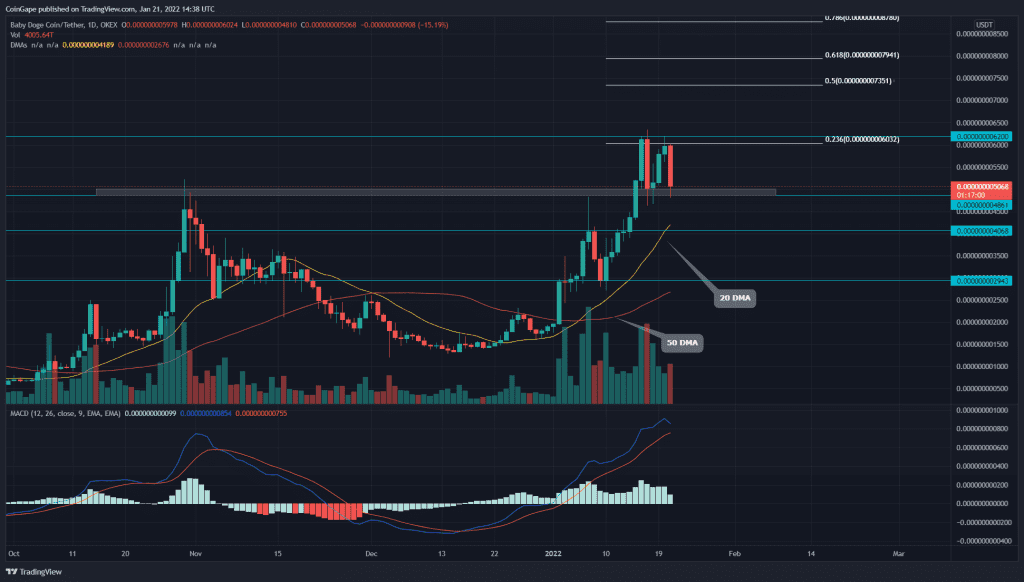
The BabyDoge price completing its Cup and handle pattern indicates high potential for this token. However, the babyDoge price is still stuck in a retest phase, trying to find demand from the $0.000000005 mark. Check out the complete article to know if you should buy Babydoge now?
Source-Tradingview
The Past Performance Or Trend
During the latter half of December 2021, the BabyDoge price started to recover from its previous correction phase that started in November. This parabolic rally provided a gain of 261% and reached the previous swing high of $0.000000005.
Moreover, the technical chart revealed a Cup and handle pattern in the daily time frame chart with this recovery rally. On January 15th, the token price gave a decisive breakout from the $0.000000005 neckline, projecting an excellent opportunity for long traders.
Baby Doge Price Shows A Double Bottom Pattern

Source-Tradingview
The BabyDoge price rejected from the $0.0000000062 entered into a retest phase. The token price plunged to $0.000000005 and tried to bounce back with a morning star pattern; however, the overhead resistance and the ongoing sell-off in the overall crypto market rejected the price again.
Until the price sustains above the $0.000000005 support, the crypto traders can maintain a bullish sentiment. However, on a contrary note, the lower price chart shows a double bottom pattern with the same neckline support.
If this pattern triggers a fallout, the Baby could enter another correction.
At the press time, the current price of the BabyDoge token is trading at $0.00000000506 with an intraday loss of 15.24%. Moreover, the 24hr volume change is $50.7 Million, indicating a 30.9% gin. According to coinmarketcap, the token stands at #2843rank with its current market cap of $805.9 Billion
Technical Indicators
The BabyDoge token price trading above the crucial DMAs(20, 50, and 100) projects a bullish trend. Moreover, the chart also shows a bullish crossover of the 50 and 100 DMAs, encouraging the ongoing bullish rally.
The Moving average convergence divergence shows the MACD and signal line was steady rallying in the bullish territory. However, the current retest phase in price action might trigger a bearish crossover of these lines.
As per the trend-based Fibonacci extension
- Resistance level: $0.0000000073, $0.0000000079
And in case of a possible correction, Fibonacci retracement suggest
- Support levels: $0.000000005, $0.0000000042


