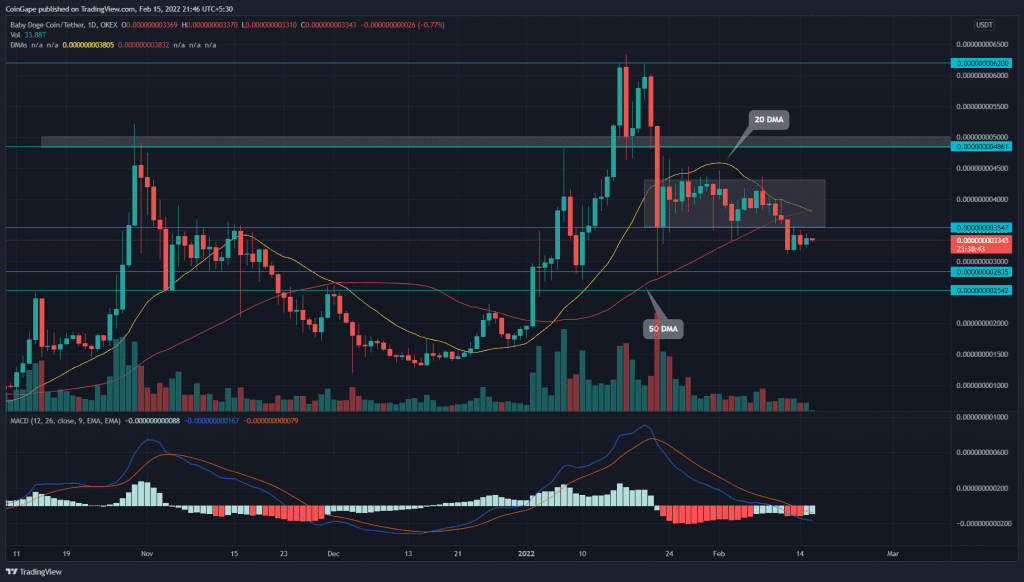
The ongoing retracement has tumbled the BabyDoge price by 47% from the January 17th high($0.0000000635). Over the past three weeks, the bears took a short break consolidating in a narrow range. On February 7th, the sellers took the lead and slipped the altcoin below the $0000000036, indicating the correction phase could extend.
Key technical points:
- The BabyDoge chart shows a bearish crossover of the 20-and-50-DMA
- The 24-hour trading volume in the BabyDoge is $11.5 Million, indicating a 30% gain.
Source-Tradingview
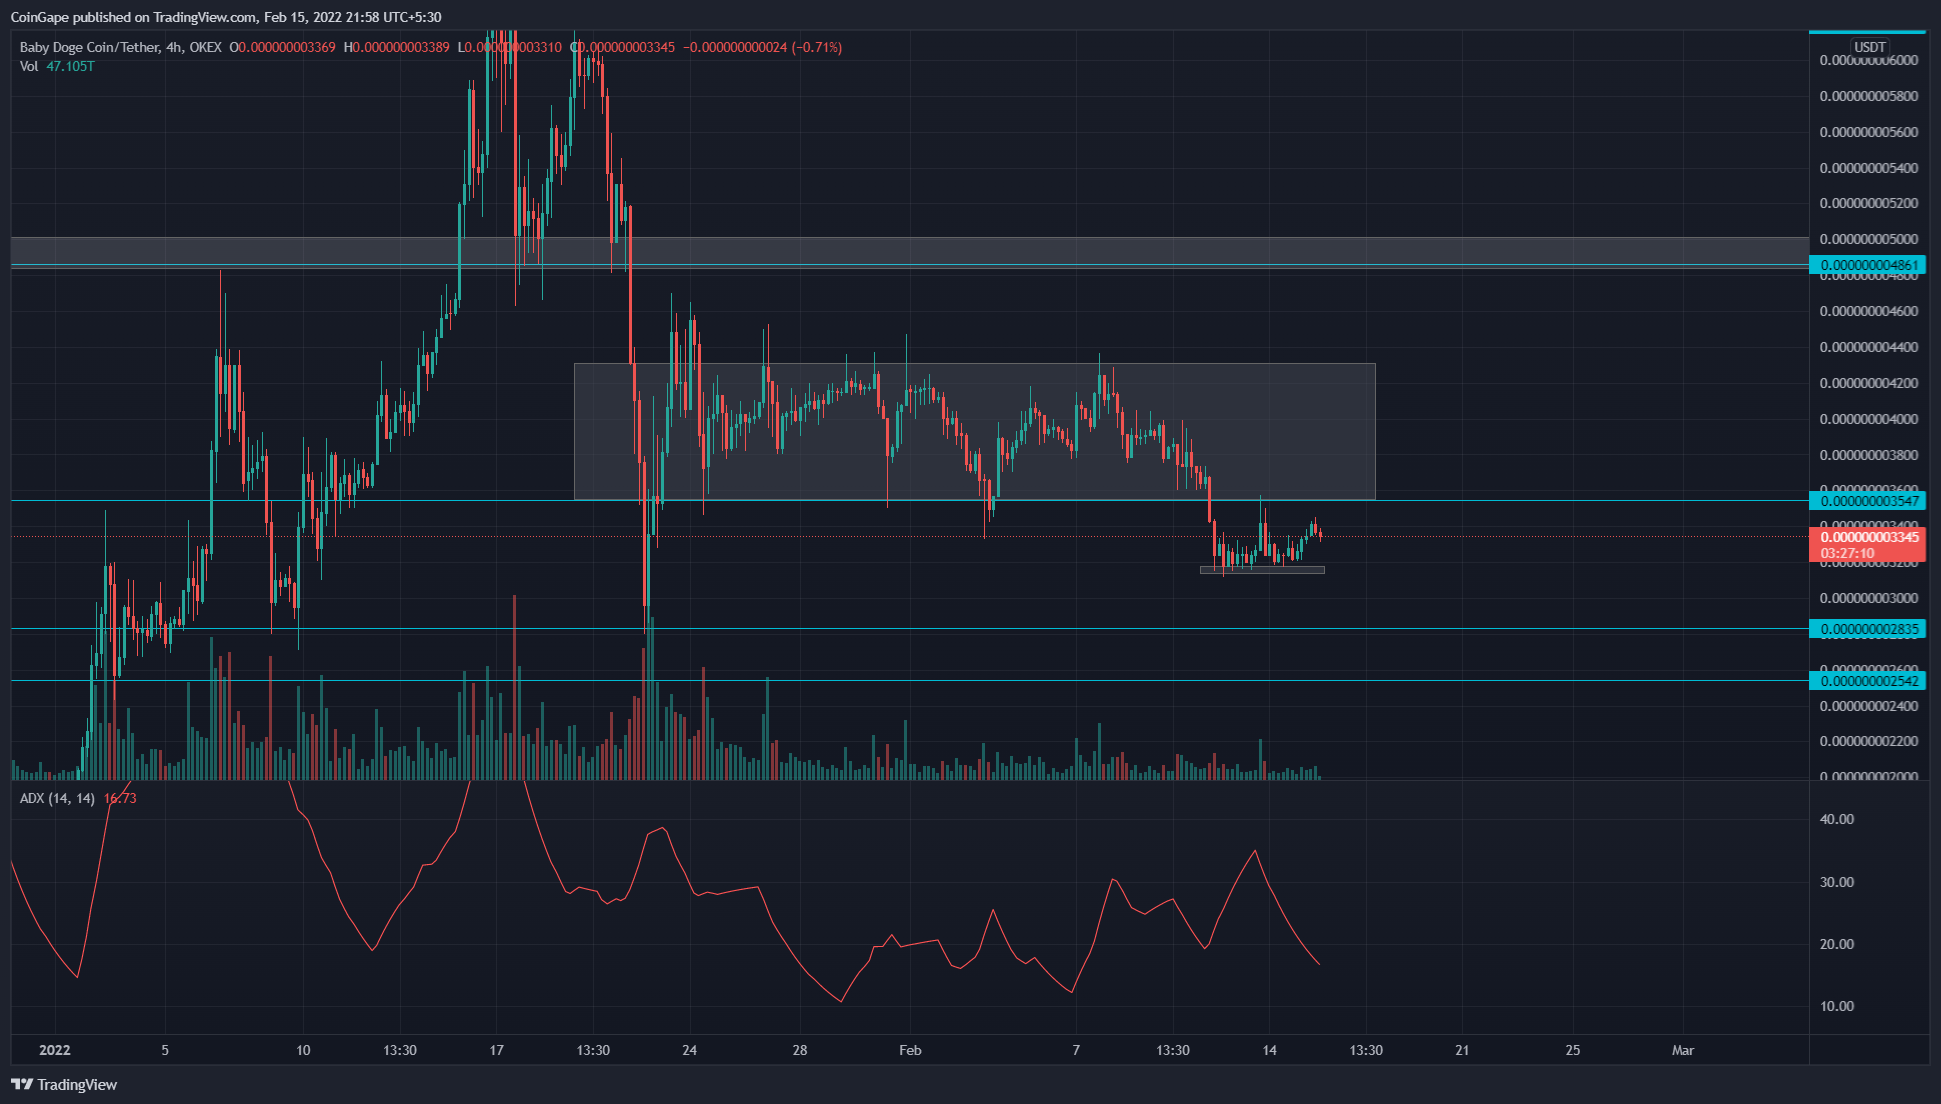
During February’s first week, the BabyDoge/USDT pair continued to resonate between $0.0000000043 and $0.0000000036 levels. On February 12th, the tug of war between the bulls and bears finally came to an end when the sellers dipped the pair below the bottom support.
The decisive breakout from this range indicated the resumption of the downtrend. However, for the past three days, the BabyDoge traders are trapped in a retest phase, trying to sustain below the $0.000000006.
The downsloping 20-DMA slips below the 50-DMA. This bearish crossover could encourage sellers to drive the price lower. Moreover, The Moving average convergence divergence indicator shows the MACD and signal crossed below the neutral zone(0.00), providing an extra edge to sellers.
BabyDoge Sellers Struggling To Sustain Below $0.0000000036

Source- Tradingview
If BabyDoge price continues to trade below the $0.00000000359 mark, the selling pressure could intensify, and the altcoin would tank 15% towards the $0.0000000028.
However, the buyers are aggressively defending the $0.00000000317 level, trying to push the coin price above the overhead resistance level. If they succeed, BabyDoge would reenter the previous range and could drive to the $0.0000000043 mark.
The down-slopping Average directional movement index(31) shows weakness to the selling momentum.
- Resistance level: $0.00000000355 and $0.0000000043
- Support level: $0.00000000317, $0.00000000283


