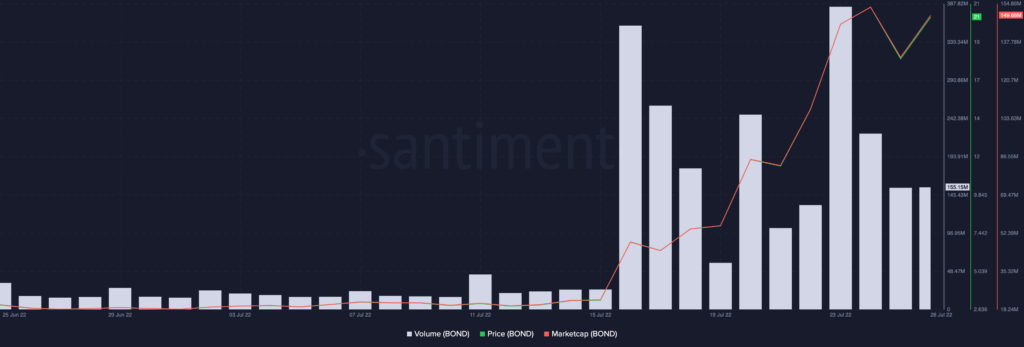
The past few weeks have revealed a new player on the chain — BOND. As per data from Santiment, BarnBridge’s native token has revealed significant price action – both on the charts and on the chain.
Additionally, since 15 July, the price of BOND token has grown by over 200%. Exchanging hands at $21.24 at the time of writing, how else has this token fared?
BOND on a mission
Since 15 July, BOND has recorded a massive growth in its price. On 15 July, its price was pegged at $3.23. However, in the last 11 days, the price of the token has grown by 291%. At press time, the token exchanged hands at $20.98.
Recording growth of over 557%, the token’s market capitalization rose from $22.66 million to $149.66 million in the said period.
With the price boom in the period under review, trading activity for BOND also rose significantly. At press time, the trading volume was spotted at 155.15 million, registering over 80% growth in the last 11 days.
Still, on an uptrend, data from CoinMarketCap revealed a 21% uptick in the price of BOND in the last 24 hours.
On the daily chart, the token’s Relative Strength Index (RSI) has been on an uptrend since 14 July. At press time, this key indicator was pegged at 79.68.
Similarly, the token’s Money Flow Index (MFI) was parked at the severely overbought region of 93.45. With these indicators on an uptrend in the last few days, a significant accumulation of the tokens has been underway, hence the price growth.
However, it is pertinent to point out that the RSI and MFI occupy severely overbought positions, and it is not uncommon for this to be followed by a sharp retracement in the price.
On-chain activity levels
Santiment revealed a growth in the token’s on-chain activity along with its price. The index for the unique addresses that transacted BOND in the period under review also grew by 51%.
At press time, daily active addresses on the network stood at 109 addresses. This metric rose to a high of 606 addresses on 23 July. Furthermore, the growth of new addresses on the network shot up by over 800% in the period under review.
The aggregate amount of tokens involved in all transactions completed within the period under review touched a high of 9.66 million on 16 July. After that, it began declining and was pegged at 566,000 by press time.
Furthermore, since 15 July, BOND’s Mean Dollar invested Age (MDIA) has taken on a downtrend. When the MDIA slope of a token decrease, this is usually indicative of a bull run on the token.
This has been so in the case of BOND in the past 11 days. Interestingly, holders of 100 to 100,000 BOND decreased their holdings as the coins pumped. But, unbeknownst to this category of investors, the coin continued to pump regardless.


