BeInCrypto takes a look at the price movement for seven different cryptocurrencies, including Basic Attention Token (BAT), which has begun an upward movement after creating a bullish pattern.
BTC
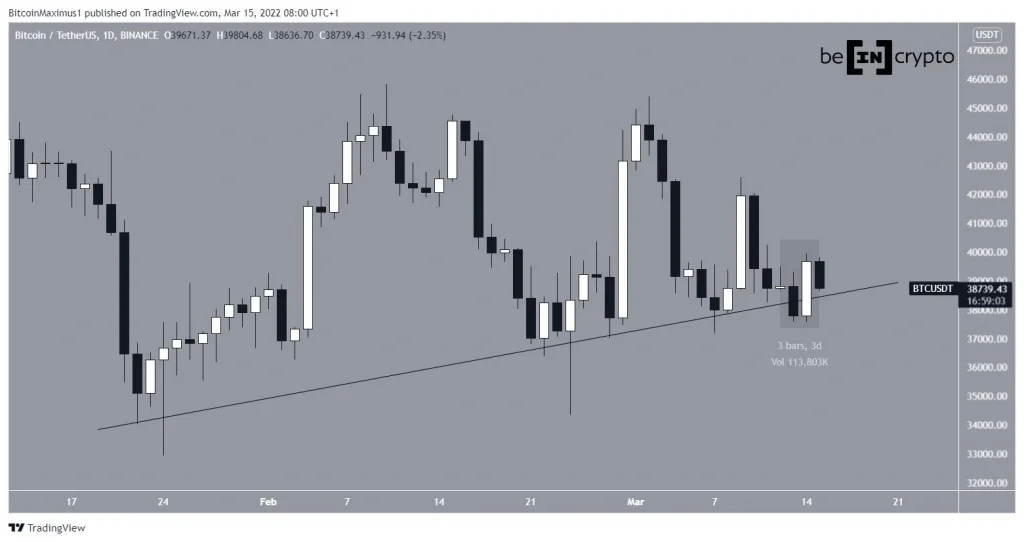
BTC has been following an ascending support line since Jan 22. On March 14, it seemingly broke down from this line. However, it created a bullish engulfing candlestick the next day, reclaiming the support line in the process.
While this is a bullish development, the direction of the future movement remains unclear.
ETH
ETH has been trading inside an ascending parallel channel since Jan 24. Such channels are considered corrective movements, meaning that a breakdown from it would be the most likely scenario.
In addition to this, ETH is currently trading in the lower portion of this channel, supporting the possibility of a breakdown.
The support line of the channel is currently at $2,400.
XRP
Since Jan 22 (green icon), XRP has been following an ascending support line. Most recently, the line was validated on Feb 24.
While the resistance line has not been validated sufficient times, it is possible that XRP is trading inside a symmetrical triangle. This is considered a neutral pattern, meaning that both a breakdown and breakout remain possible.
BAT
In the period between Jan 24 and March 13, BAT hovered above the $0.67 horizontal support area. On Feb 24, it seemingly decreased below it but created a long lower wick (green icon), reclaiming the area in the process.
The wick is considered a sign of buying pressure.
Throughout this entire period, BAT has created what looks like a triple bottom, which is considered a bullish reversal pattern. Furthermore, it broke down from a descending resistance line on March 13.
If the upward movement continues, the closest resistance area would be at $0.95.
RUNE
On March 11, RUNE broke out from a descending resistance line and validated it as support the next day (green icon).
Since then, it has been increasing at an accelerated rate, leading to a high of $8.06 on March 15.
If a short-term retracement occurs, the resistance line of the previous channel at $7.05 would be expected to provide support.
MATIC
On Feb 24, MATIC began an upward movement, reclaiming the $1.35 horizontal support area in the process. This was an extremely bullish development, since it previously had broken down below it. Such deviations are usually followed by a significant movement in the other direction.
If MATIC breaks out from the current descending resistance line, it would be expected to increase towards the closest resistance area at $1.65.
LUNA
On March 9, LUNA reached an all-time high price of $1.04. However, it decreased almost immediately afterwards, leading to a low of $0.85 on March 13.
LUNA is still trading below the $94 horizontal resistance area. Until it reclaims it, the trend cannot be considered bullish.
For BeInCrypto’s latest Bitcoin (BTC) analysis, click here
Disclaimer
All the information contained on our website is published in good faith and for general information purposes only. Any action the reader takes upon the information found on our website is strictly at their own risk.


