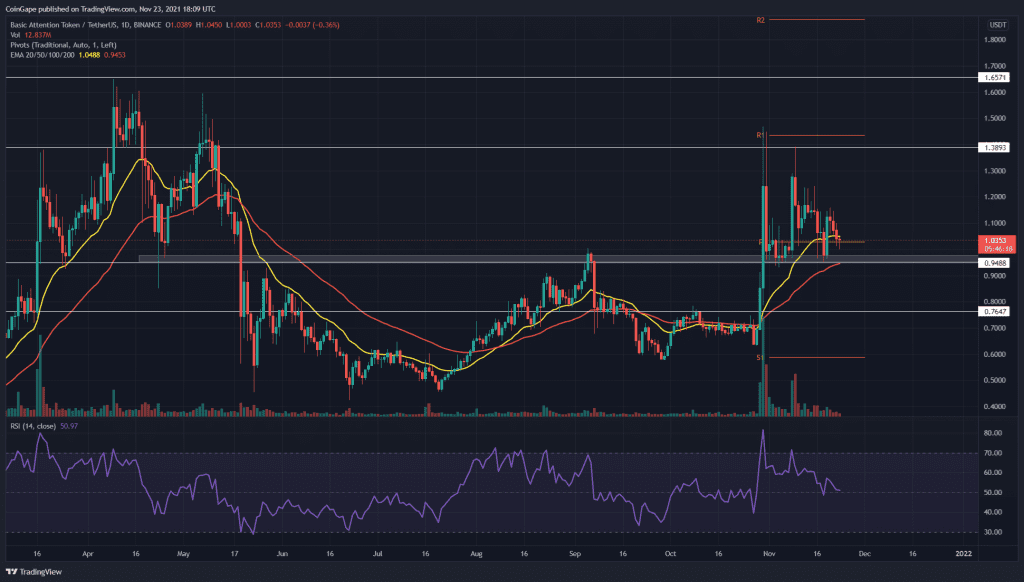
The BAT/USD chart presents the token is still under an uptrend. However, the token price is quite close to the crucial support of $1, and with the current bearish momentum, it poses a good chance to drop below this level. Check out what can be expected next?
Key technical points:
- The BAT token forms a descending triangle pattern in the 4-hour time frame chart
- The daily RSI line drooping at a greater speed than the price action
- The intraday trading volume in the BAT token is $180.7 Million, indicating an 8% loss
Source- BAT/USD chart by Tradingview
Reclaiming the $1 resistance was a crucial step up for the BAT token investors. This rally was triggered at the end of October, significantly increasing the token price by reaching the $1.4 mark. However, the price had to retrace back to retest the new support of $1 and till today its is still hovering near this level.
As per the crucial EMAs(20. 50, 100, and 200), the BAT token still maintains its bullish trend as the price is trading above these EMA lines.
The Relative Strength Index(51) line is steadily dropping to the lower level, indicating the increasing strength of the market sellers.
BAT/USD Chart In The 4-hour Time Frame

Source- BAT/USD chart by Tradingview
This BAT price action suggests an even further fall in the token by forming a descending triangle pattern in the 4-hour time frame chart. The neckline for this pattern is at $0.95, and the token traders could grab a great short opportunity if the price gives a proper breakdown from this bottom support.
The MACD indicators project a bearish momentum in this token, where both its line MACD and signal are moving below the neutral zone.
.
.
.
.
.
.
.
.


