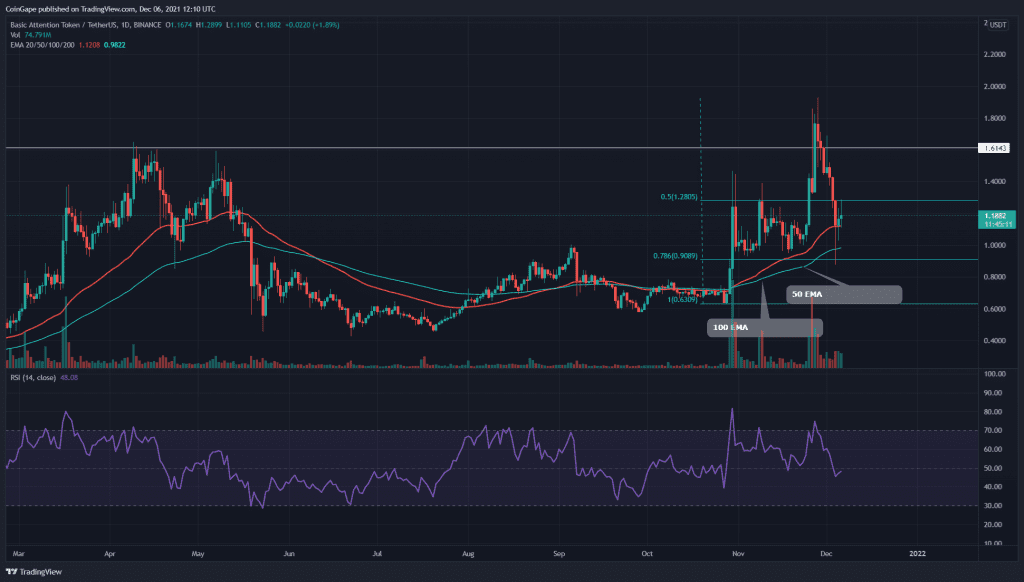
The BAT token price lured several crypto traders when the price gave a decisive breakout from the previous All-Time High of $1.62. However, the market sellers took over and dropped the price below the breakout level and initiated a moderate pullback in this token. So far, the price has plunged to the 0.786 FIB level, trying to maintain a bullish sentiment.
Key technical points:
- The BAT showed a V-top bearish reversal in its technical chart
- The intraday trading volume in the BAT token is $947.5 Million, indicating a 58.91% gain.
Source- BAT/USD chart by Tradingview
On November 27th, the BAT token price indicated an excellent opportunity for crypto traders when its price breached the previous All-Time High of $1.62. However, the price couldn’t sustain above this level and immediately fell below the breakout level.
Thus, several long traders got trapped in this fakeout, resulting in the liquidation of their long position. The token experienced a more than 40% fall in just five trading days, which plunged the token price near the $1 support.
The crucial EMA level(20, 50, 100, and 200) still indicates an overall uptrend for the token. Moreover, the Relative Strength Index(48) displayed a significant drop for this retracement phase, offering even more room for potential growth.
BAT/USD 4-hour Time Frame Chart

Source- BAT/USD chart by Tradingview
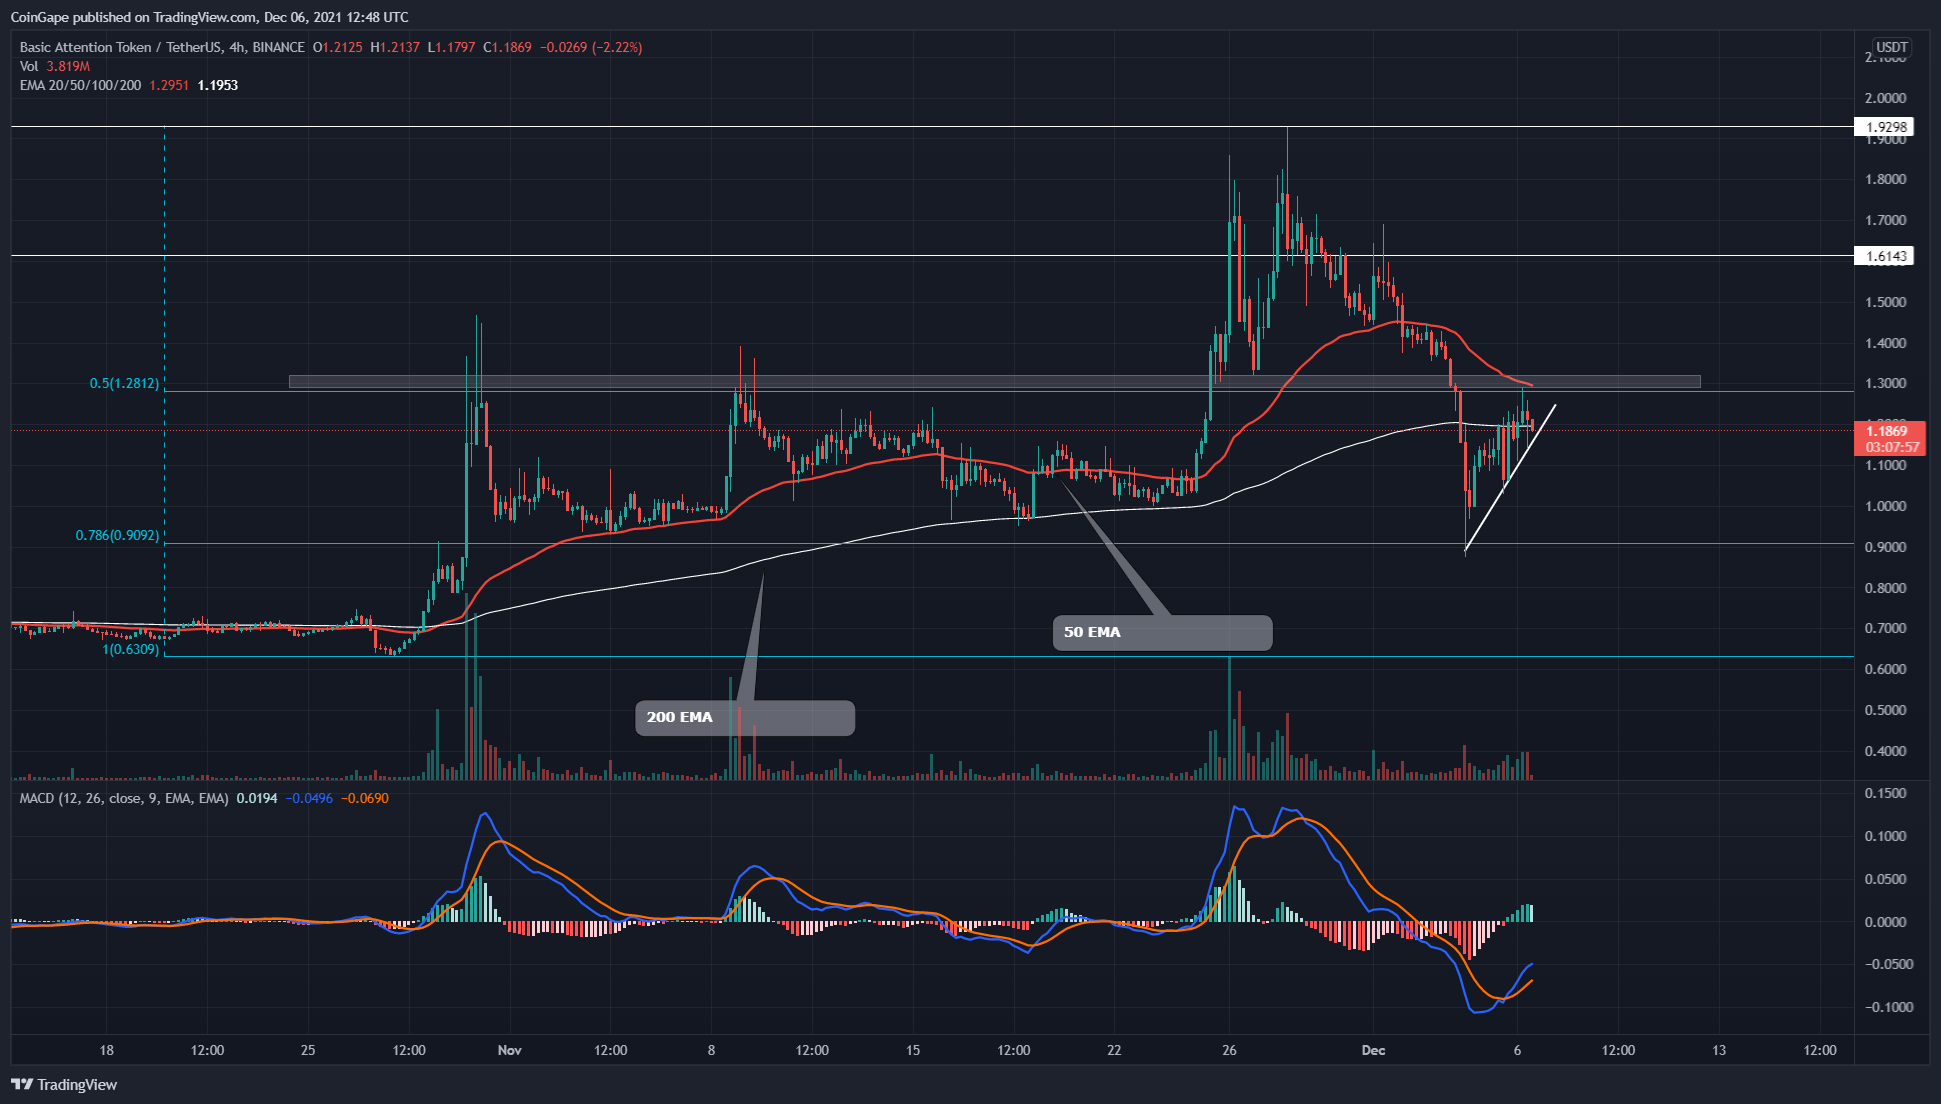
This V-top reversal in BAT price plunged the token price to support the $1 mark. This horizontal support level with the confluence of 0.786 Fibonacci retracement level is crucial support that has the potential to start a new rally.
However, the crypto traders should wait for the price to breach the nearest resistance zone at around $1.3, providing a significant edge for long traders. The token price shows a decent recovery from this level, allowing it to challenge this overhead resistance .


