Cosmos was a notable gainer on Tuesday, as prices of the token rose by as much as 12% in the day. Today’s surge sees the cryptocurrency climb for a third straight day, hitting a five-day high in the process. Near protocol was also in the green, as it rebounded following recent declines.
Cosmos (ATOM)
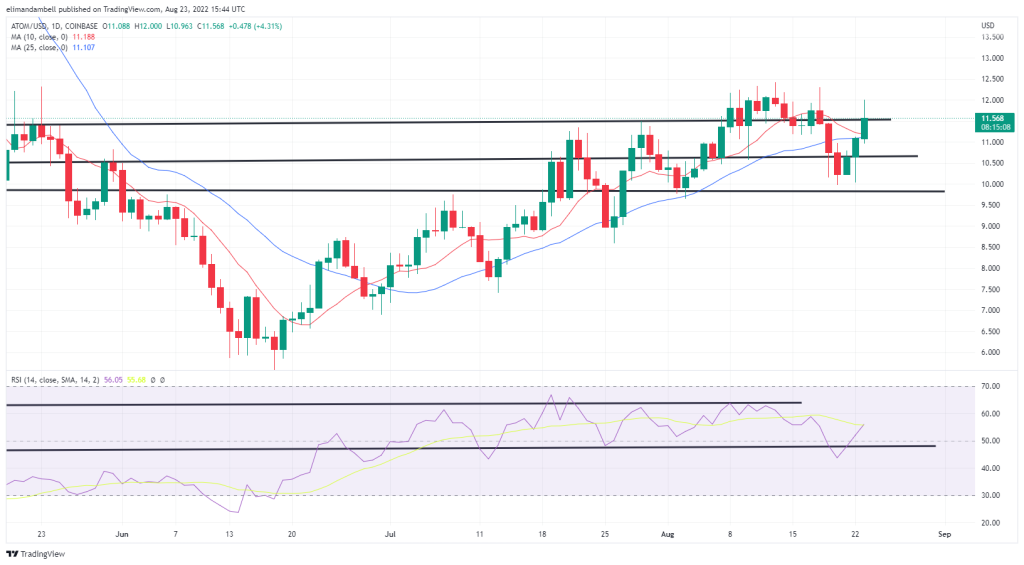
Cosmos (ATOM) was one of Tuesday’s big gainers, as prices of the token surged by as much as 12%.
Following a low of $10.25 to start the week, ATOM/USD rallied earlier today, hitting a high of $11.93 in the process.
Today’s peak sees ATOM climb higher for a third straight session, hitting its highest level since August 18 in the process.

Looking at the chart, today’s move came as the token briefly broke out of a key resistance level of $11.55.
As of writing, ATOM continues to trade above this ceiling, however earlier gains have faded, with price currently at $11.56.
Overall, it appears as if previous bulls have turned bearish, liquidating their positions shortly after today’s breakout.
Near Protocol (NEAR)
In addition to cosmos, near protocol (NEAR) was also in the green in today’s session, as prices rebounded following recent losses.
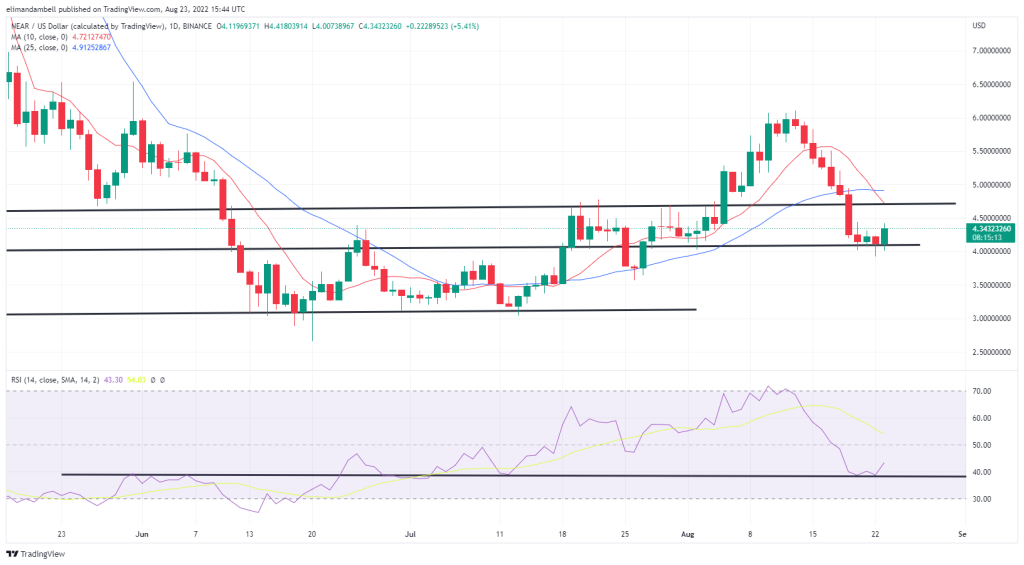
NEAR/USD rallied to an intraday peak of $4.41 on Tuesday, climbing over 8% higher than Monday’s low.
Yesterday saw NEAR briefly fall below its support point at the $4.10 level, however bulls rejected a full break, and instead bought the dip.

Today’s rebound in price comes as another rebound took place, on this occasion it was via the 14-day relative strength index (RSI).
As seen on the chart, the floor of 38.15 avoided a breakout of its own, and as of writing RSI is tracking at 43.45.
The next target for bulls is likely $4.70, however this will be made difficult following a downside cross of the 10-day (red) and 25-day (blue) moving averages, which could be signaling the prospect of further mid-term declines.
Register your email here to get weekly price analysis updates sent to your inbox:
What is behind today’s rebound in crypto prices? Let us know your thoughts in the comments.
Image Credits: Shutterstock, Pixabay, Wiki Commons
Disclaimer: This article is for informational purposes only. It is not a direct offer or solicitation of an offer to buy or sell, or a recommendation or endorsement of any products, services, or companies. Bitcoin.com does not provide investment, tax, legal, or accounting advice. Neither the company nor the author is responsible, directly or indirectly, for any damage or loss caused or alleged to be caused by or in connection with the use of or reliance on any content, goods or services mentioned in this article.
Read disclaimer


