Tron (TRX) rallied to a five-month high earlier in today’s session, as bulls continued to feed off recent news of the USDD stablecoin. While TRX climbed to multi-month highs, WAVES moved away from a two-month low today, as prices surged by as much as 15%.
Tron (TRX)
May the 4th was definitely with Tron on Wednesday, as TRX was one of the most notable gainers in today’s session, with prices surging to a five-month high.
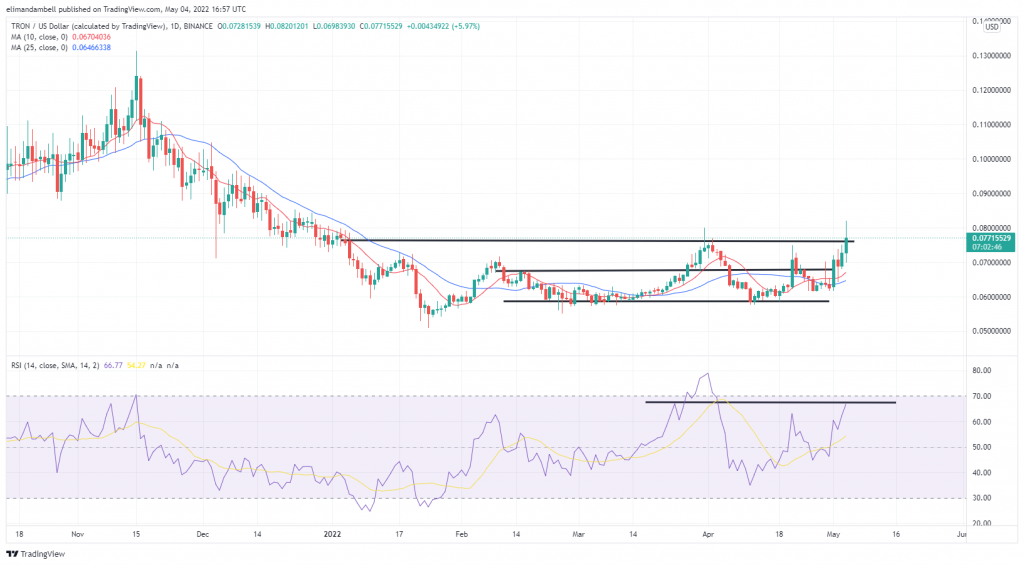
Following a low of $0.07003 during Tuesday’s session, TRX/USD raced to a high of $0.08134, breaking out of a key resistance level in the process.
The move saw the ceiling of $0.07600 broken, which resulted in TRX hitting its highest level since Christmas day last year.

Although earlier gains have since eased, which is likely as a result of bulls liquidating positions, prices are still marginally above the resistance.
As of writing this, TRX is now trading at $0.07688, which is close to 7% higher than yesterday’s bottom.
The 14-day RSI is now tracking at 66.11, which is the most price strength it has hit since April 2, 2022, and is close to yet another ceiling of 67.54, and another potential reason as to why earlier gains have eased.
WAVES
While TRX was the most notable gainer on Wednesday, WAVES was easily the biggest, with prices climbing by as much as 15%.
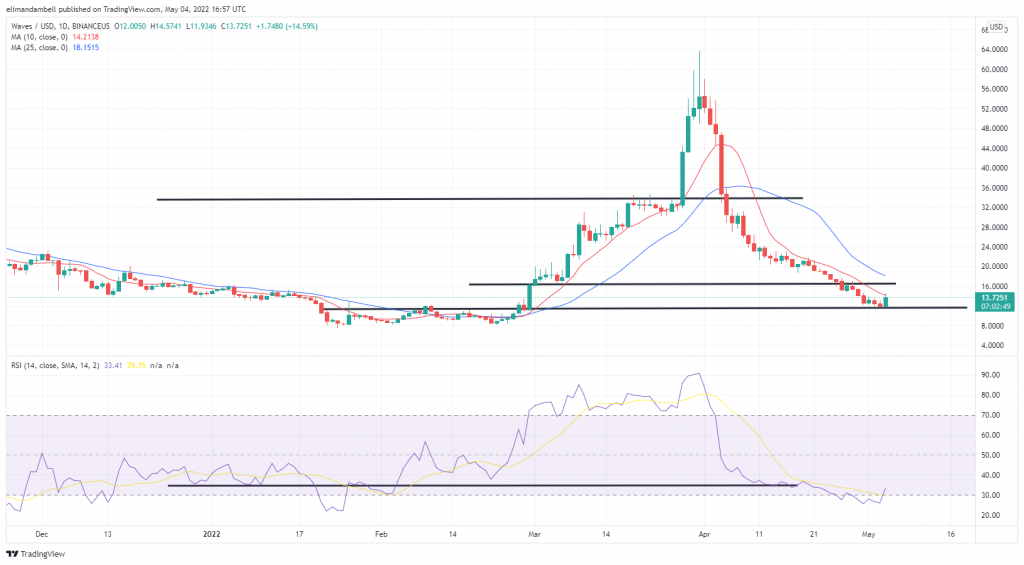
WAVE/USD rose to an intraday high of $14.45 earlier today, as prices rebounded from their lowest level in the last two months.
Tuesday saw WAVES hit a bottom of $11.89, which is just above its floor of $11.80, and the lowest price has been since February 28.

However, as seen on the chart, a bull run followed the last time WAVES traded at this level, and today’s moves increase hope for a reversal in price.
WAVES was one of the hardest-hit tokens during April’s crypto red wave, with prices going from a peak of $63.69, all the way to the recently stated floor.
Price strength currently hovers at 33.36 as seen on the RSI, which is deep in oversold territory, and could be a good sign for those who believe we may have seen the worst.
Will we see April’s red wave begin to fade the deeper we get into May? Let us know your thoughts in the comments.
Image Credits: Shutterstock, Pixabay, Wiki Commons
Disclaimer: This article is for informational purposes only. It is not a direct offer or solicitation of an offer to buy or sell, or a recommendation or endorsement of any products, services, or companies. Bitcoin.com does not provide investment, tax, legal, or accounting advice. Neither the company nor the author is responsible, directly or indirectly, for any damage or loss caused or alleged to be caused by or in connection with the use of or reliance on any content, goods or services mentioned in this article.
Read disclaimer


