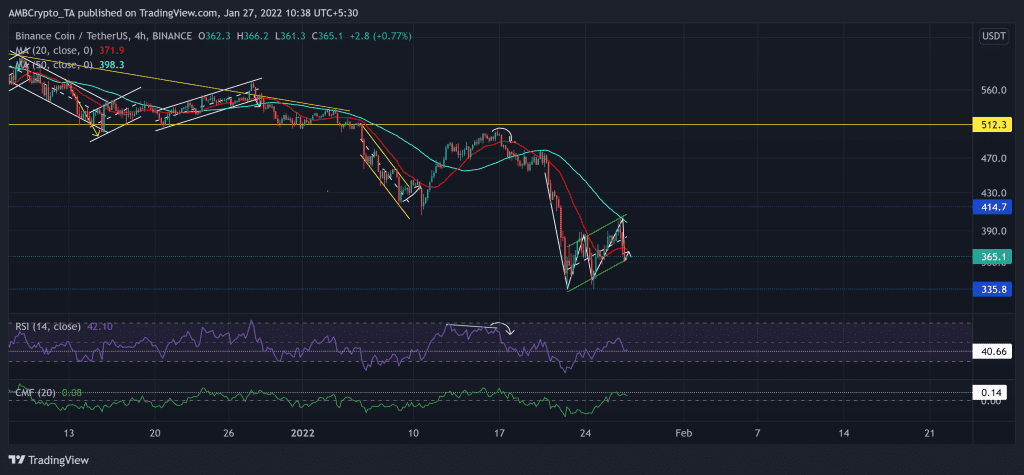
The last 24 hours have yet again damaged the global crypto market cap. Consequently, Binance coin, Avalanche and EOS flashed bearish flag tendencies on their 4-hour chart. Binance coin fell below its 20-50-200 SMA while Avalanche reversed from the 55 EMA.
EOS still struggled with the $2.28-mark while its 4-hour RSI confirmed a bearish edge.
Binance Coin (BNB)
The alt has been on a descent since 7 November. After breaking down from its long-term descending triangle, it witnessed two substantial sell-offs. As a result, BNB noted a 34.78% loss (from 5 January) and touched its 16-week low on 24 January.
Gradually, the bears flipped the three-month support at the $414-mark to resistance. Over the past few days, the alt formed a bearish flag on its 4-hour chart. Now, the immediate resistance for the bulls would be at the 20-SMA followed by the upper trendline of the channel.
At press time, the BNB was trading below its 20-50 SMA at $365.1. After dipping towards the record low of 18.28, the RSI saw a 36 point revival and crossed the half-line on 26 January. However, after failing to sustain the rally, it dipped to find support at the 40-mark. Meanwhile, the CMF managed to sway above the zero-line but weakened from the 0.14 resistance.
Avalanche (AVAX)
The double-bottom breakout on its 4-hour chart failed to cross its month-long resistance at the $96.49-mark. AVAX saw a 54.8% retracement (since 2 January) and poked its 14-week low on 24 January.
Accordingly, it fell below all its EMA ribbons while the selling influence heightened. Now, the 20-EMA yet again stood as an immediate hurdle for the bulls to conquer.
At press time, the altcoin was trading at $62.18. Since its head and shoulder breakdown, the RSI recovered and moved above the equilibrium. But the 4.27% 24-hour loss propelled it to fall toward the 39-mark support. Further, the MACD histogram weakened as it approached the half-line. Also, the MACD and the signal line seemed on the verge of a bearish crossover.
EOS
While the bulls failed to step in at the $2.9-level, the alt has steadily declined. The down-channel (white) breakout reversed after the broader fallout as EOS marked a 30.41% decline and touched its 22-month low on 24 January.
Now, EOS too saw a bearish flag on the 4-hour chart. The immediate testing point for the bulls continued to stand at the $2.28-mark
At press time, EOS traded at $2.166. The RSI showed improvement signs but failed to sustain above the half-line while even losing the 43-mark level. Further, the AO depicted a position of neutrality after hinting at decreasing bearish influence.


