- BNB price ranges below 50 and 200 EMA on the daily timeframe.
- BNB shows bullish strength on the 4H timeframe as price breaks an asymmetric triangle.
- The price could be poised to retest the 1D and 4H resistance of $280.
Binance Coin (BNB) price showed bullish strength in recent weeks, but the price has failed to match that run against tether (USDT). With the price of Binance Coin facing resistance to breaking above $337, acting as a tough resistance area, the price of BNB has maintained a downtrend as the price broke its bullish structure. (Data from Binance)
Binance Coin (BNB) Price Analysis On The Weekly Chart
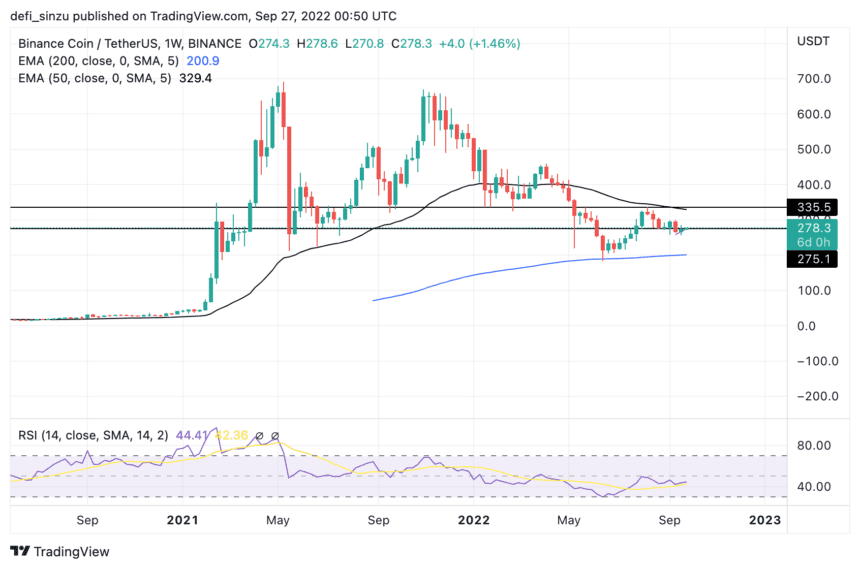
The price of BNB has recently declined after bouncing from its weekly low of $210 as a price rally to a high of $340 before facing a stip rejection, and the price has struggled to re-establish its bullish trend.
The price of BNB is still above a critical support level of $270, which acts as a good demand zone for buy orders. The price of BNB must break through its weekly resistance of $280 in order to trend higher.
To restore a relief bounce, the price of BNB must break and hold above the $280 resistance, which is preventing the price of BNB from trending higher. If the price of BNB continues to reject $280, we may see a retest of $270 and possibly a lower support area of $210 on the weekly chart.
If the price of BNB breaks and holds above $340, this could start a major rally as this has proven to be a tough area to break out for BNB price.
Weekly resistance for the price of BNB – $340.
Weekly support for the price of BNB – $270.
Price Analysis Of BNB On The Four-hourly (4H) Chart

The price of BNB continues to show strength in the 4H timeframe, breaking out of its downtrend range after forming an asymmetric triangle with good volume.
The price of BNB is $278, which is higher than the 50 EMA but lower than the 200 EMA. The 50 EMA acts as a support for the BNB price, while the 200 EMA acts as resistance. Prices at the 50 and 200 EMA for BNB are $274 and $280, respectively.
Four-Hourly resistance for the BNB price – $280.
Four-Hourly support for the BNB price – $274-$250.
Onchain Analysis Of BNB

The price of BNB from the on-chain analysis looks more decent, producing a reasonable return on investment (ROI) compared to other crypto assets that have struggled for the past three months. With backing from investors and partnerships, the price of BNB could do well.
Featured Image From zipmex, Charts From Tradingview and Messari


