Disclaimer: The information presented does not constitute financial, investment, trading, or other types of advice and is solely the writer’s opinion.
Bitcoin struggled to hold on to the $20.8k level a couple of weeks ago. The increased selling pressure saw BTC fall to $19.5k, then retest the $20.4k region for liquidity.
The short-term structure had a bearish look, and the price has already tested the liquidity near the $19.8k area. Based on price action, a move upward could materialize across the market.
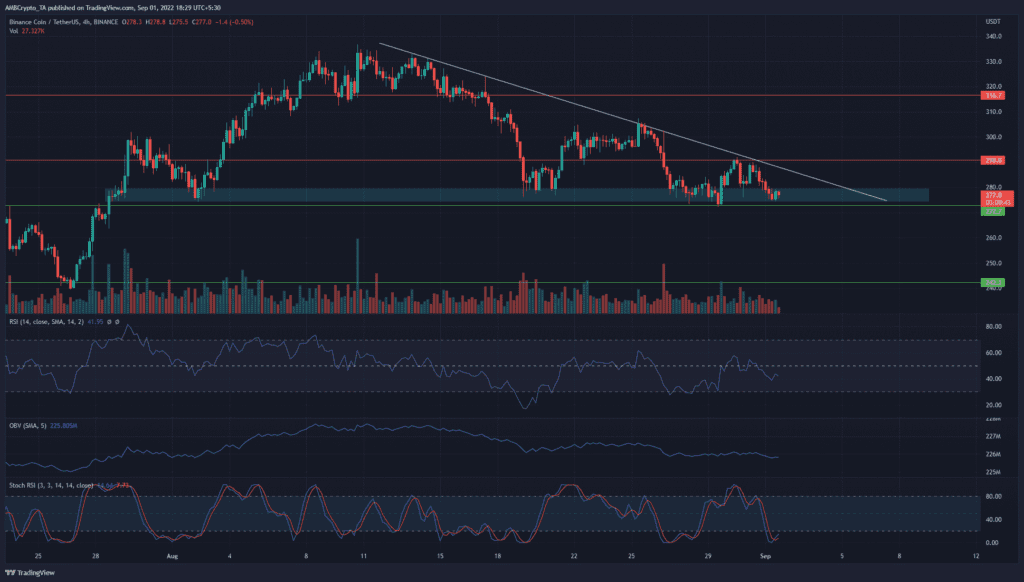
Binance Coin has also traded in the $276 demand zone for a significant portion of the past week. Could BNB also push toward the $300 zone in search of liquidity?
BNB- 4-Hour Chart
BNB appeared to form a descending triangle pattern from mid-August to the time of writing, as it made a series of lower highs from $315.
At the same time, the price formed a decent base at $270-$275. Based on this observation, we can conclude that a drop below $272 and a retest of the same level as resistance would likely see BNB fall further, toward $240.
Going back to mid and late July, the $270 zone (cyan box) has been significant as both support and resistance. In the past couple of weeks as well, the same zone has resisted the advances of the bears.
On the 4-hour chart, the momentum has sided with the bears, per the RSI. The momentum indicator has been unable to stay above neutral 50, nor has it succeeded in climbing past the 60 value to signal bullish strength.
The OBV has steadily dropped as well to highlight selling pressure. A bullish crossover on the Stochastic RSI suggested a minor bounce could occur to test the descending trendline as resistance.
BNB- 1-Hour Chart
Successive tests of a zone of demand are likely to weaken a support area. The $275 area has been repeatedly tested in the past ten days and could cave.
The A/D has also been in a steady downtrend to show the lack of significant buying pressure. Both the RSI and the Awesome Oscillator showed bearish momentum.
To the north, the $287-$295 can be expected to act as a stiff resistance. Therefore, even though BNB was at a support zone with easy invalidation below $270, the bounce might not climb very high.
Scalp longs could be profitable, although risk would need to be carefully managed.
Conclusion
Over the next day or two, Binance Coin could embark on a move toward $300 and $316, or below $270 toward $242.
It largely depended on whether Bitcoin would be able to defend the $19.6k-$19.8k region of support.
The momentum indicators highlighted bearish momentum and prominent selling volume behind Binance Coin in the past few days.
The lack of accumulation at an important demand zone suggested that any bounce toward $290-$300 for BNB could be short-lived.
A move past the $21.5k area for Bitcoin, combined with BNB flipping $300 to support, would be necessary to flip the bias for BNB for the next week or two to bullish.


