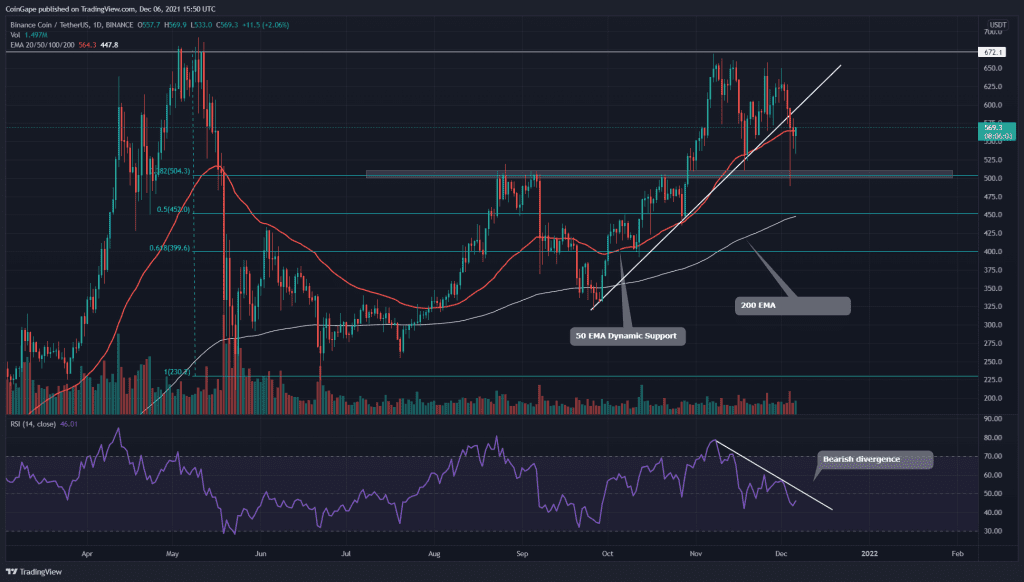
The BNB coin price struggles to overcome the All-TIme High resistance zone around $660. On December 1st, the price obtained strong rejection from this resistance and initiated another retracement phase. The price dropped 20% from the above level and already retested the near support of the $500 mark. This has created two crucial levels for BNB, and further course for the price will be dependent on their breakout.
Key technical points:
- The 50 EMA dynamic support is flipped to a potential resistance
- The RSI line shows a strong bearish divergence in the daily chart
- The intraday trading volume in the BNB coin is $323 Million, indicating a 36.8% gain.

Source- BNB/USD chart by Tradingview
The last time when we covered an article on BNB/USD, the coin price was steadily charging towards the All-Time High resistance in an attempt to complete a Cup and Handle pattern in the daily time price chart. However, the price never breached the $680 neckline, indicating a bearish reversal; it plunged to the $500 mark.
With the recent bearish reversal, the price has knocked out some crucial dynamic support like- an ascending trendline and the 50 EMA Line. Moreover, the chart also displays a double bottom pattern with the neckline at $500, suggesting even more fall in this coin.
The Relative Strength Index(43) displays a bearish outlook in its chart, with the line steady approaching the oversold zone.
On the contrary note.
The overall trend for this BNB coin is still bullish, and even with the currently bearish signals and the Cup and Handle pattern is still instant until the $500 is sustained.
Thus, the long holders will have their first warning if the price breaks down the $500 support level, which will also activate the double bottom pattern for a quick target to the $450


