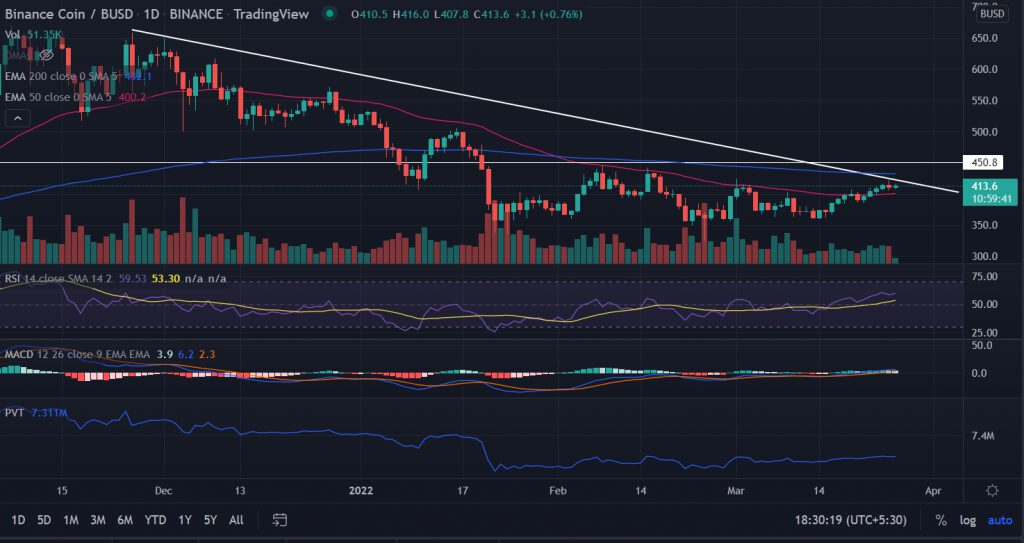
BNB’s price manages to hold above $400 after the previous session’s modest losses. BNB price is consolidating below $420 since testing the highs of $424 on March 1. The bearish slopping line and the 200-EMA act as a double-whammy for the buyers. The price must cross both the levels with an above-average volume to continue with the gains.
- BNB price trades in a very tight range on weekends.
- Expect more gains towards $450 above the descending trend line.
- The immediate downside is capped near the 50-day EMA.
As of writing, BNB/USD is trading at $412.89, with 0.56% for the day. The fourth-largest cryptocurrency by the market cap is holding at $1,418,907,326.
BNB price consolidates before another leg up
On the daily chart, the BNB price is facing a challenge near the $420 mark as the price is unable to breach its last time tested highs on March 1. The price has found a reliable support level of around $350. After making record lows in February BNB price surged 31% to the recent swing highs.
Now, a decisive break above the bearish slopping line will meet the first upside hurdle at the critical 200-EMA at $431. This will be a crucial base to aim for the next higher level.
An extended buying pressure will bring the psychological $450 level into play.
.OffersRow {
display: flex;
flex-wrap: wrap;
}
.offersads{ display:none;}
.Optile {
text-transform: uppercase;
font-weight: 700;
font-size: 16px;
margin: 0 0 14px;
padding: 0 5px;
text-align: left;
}.offerDv {
padding: 25px 8px 10px;text-align: left;
}.offersads {
padding: 0 13px;
margin: 0 -15px;
background: #f4f4f4;
padding: 20px 5px;
}
.twitter-tweet .offersads {
margin: 0 -40px;
padding-bottom: 20px;
}
.OffersRow .Items {
width: calc(33.3% – 10px);
margin: 0 5px;font-family: montserrat,sans-serif !important;
background: #fff; border-radius: 4px;
box-shadow: 0 1px 3px 0 rgba(0, 0, 0, 0.13);
position: relative;
overflow:hidden;
}.Items span {background: #0aac29;color: #fff;position: absolute;left: 0;top: 0;border-radius: 0px 0px 2px 0px;padding: 0 12px; font-size:12px;}
.OffersRow .h5ad {
font-weight: 600 !important;
color: #1a419a !important;
font-size: 15px !important;margin:0 !important;
}.offerSd {
color: #222222;
font-size: 12px;min-height: 35px;
font-weight: 500;display: flex;
align-items: center;
}.GetthisDeal a {
display: block;
text-align: center;
font-weight: 600; font-size: 12px;
color: #079321;
}.GetthisDeal {
border-top: 1px dashed #9b9b9b;
padding: 8px 0 0 0;
margin: 10px 0 0;
}@media(max-width:600px){
.offersads{display:block;} }Best optionsEarnEarn 20% APRClaim5 BTC + 200 Free SpinsWalletCold Wallet
On the contrary, a fall below the 50-day EMA will invalidate the bullish outlook in the asset. In that scenario, the BNB price would revisit the horizontal support level at $360.
Technical indicators:
RSI: The daily Relative Strength Index reads at 58 while moving above the average line. This indicates the underlying bullish momentum.
MACD: The Moving Average Convergence Divergence hovers above the midline with a neutral bias.
Trading volume: The Price Volume Trend indicator steadies higher from the February lows.


