After a substantial slump yesterday, Shiba Inu and Solana noted their one-month low on 26 November. However, the bulls attempted to counter the sell-off.
While the near-term trend remains bearish for most cryptos, the market flashed some revival signs. As a consequence, Binance coin, Shiba Inu, and Solana saw gains on their daily charts.
Binance Coin (BNB)
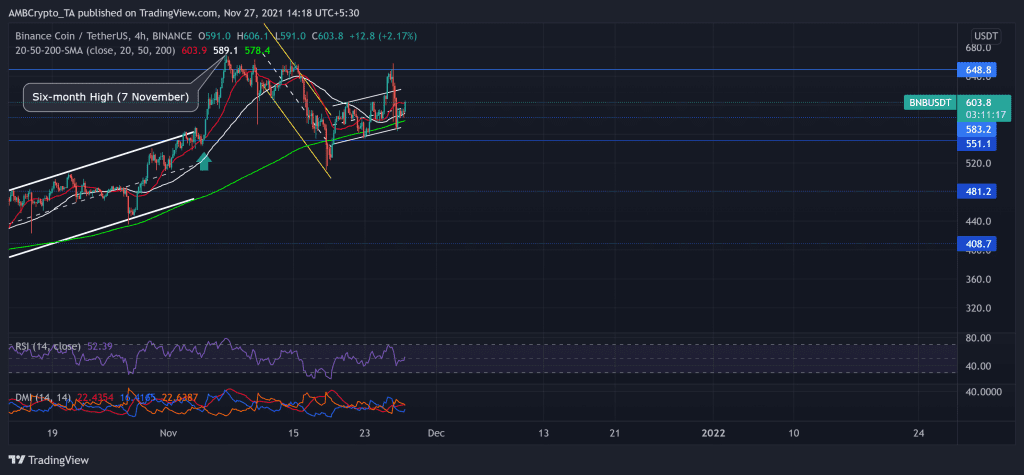
The alt consistently marked higher lows and depicted healthy bullish tendencies since 24 September. After an atrocious 78.41% rally in just 39 days (from 24 September), BNB price action touched its six-month high on 7 November.
However, the price action witnessed a 22.8% pullback until it touched its two-week low on 18 November. BNB bulls were quick to reverse the slump and continue their late September uptrend. As a result, the price inclined in an up-channel since the past week. Consequently, the alt noted a 3.3% increase in 24 hours, pushing the price above its 4-hour 20-50-200 SMA.
At press time, BNB traded at $603.8. The RSI was northbound and preferred the bullish vigor. Further, DMI chose the bears but depicted increasing bullish strength. Nevertheless, the ADX (red) displayed a weak directional trend.
Shiba Inu (SHIB)
Although SHIB managed to preserve over a million holders, the bulls have visibly failed to uphold the token’s perception as its price steadily dropped throughout November. The price action marked a down channel since 6 November. The meme coin has lost more than half of its value since it struck its ATH on 28 October.
Possibly with increased profit-taking, bulls failed to hold their ground as the coin saw a 51.8% and 19% monthly and weekly decline, respectively. Consequently, it touched its one-month low on 26 November.
At press time, SHIB traded at $0.00003944. The RSI seemed to head north after preferring the bears. Also, SHIB saw a 4% gain on its daily charts. This incline occurred after a bullish divergence (yellow) between the RSI and the price action over the past day. Further, the AO chose the bears but also hinted at their decreasing strength.
Solana (SOL)
SOL rallied by over 85% from 12 October to 6 November. With this upturn, it struck its ATH on 6 November. Since then, the correction phase kicked in as the bulls steadily lost their power.
During the downfall, SOL lost over one-fourth of its value until it touched its one-month low on 26 November. After breaching the patterned uptrend, the bears ensured to continue the downtrend. Although the bulls triggered a 21% rally from 19 to 22 November, they could not back it up with high trading volumes.
Thus, the price continued to fall in a down-channel (yellow). At press time, SOL traded at $196.1125. The RSI was weak at the 42-mark. Also, the DMI flashed a bearish bias. However, MACD and AO hinted at decreasing strength in the near term.


