The fear sentiment heightened as Bitcoin re-enters the $47,000 zone. As a result, altcoins like Binance Coin, Tron and EOS saw a blip in their recovery.
The aforestated cryptos fell below their 20-50-200 SMA, as the bears evidently displayed their edge.
Binance Coin (BNB)
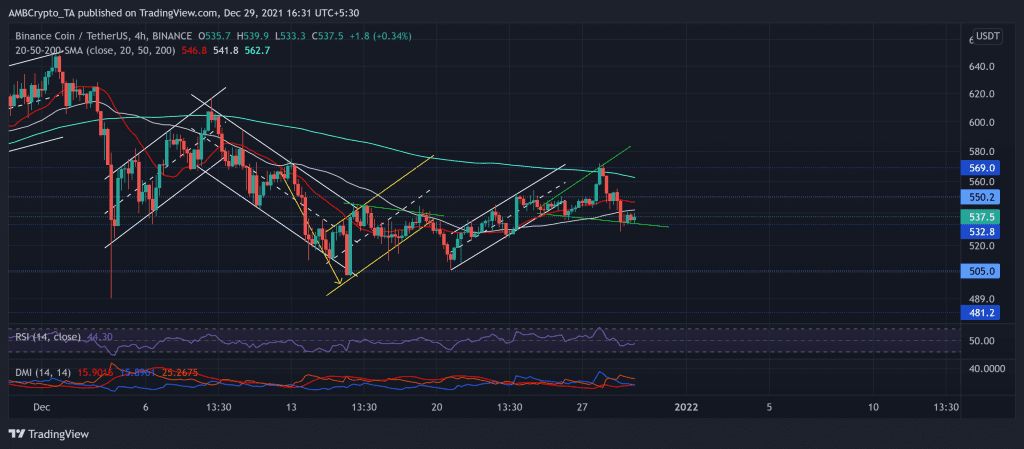
Over the past few days, BNB formed a symmetrical broadening wedge (green) on its 4-hour chart. The previous up-rally saw a steep reversal after the coin poked its two-week high on 27 December near the $569-mark resistance.
After a nearly 6% retracement in the last two days, BNB fell below $550 to find testing grounds at the $532-mark. This level also coincided with the lower trendline (green).
At press time, BNB traded below its 20-50-200 SMA at $537.5. The RSI stood at the 43-mark but showed some revival signs. The DMI resonated with the bears, but the ADX displayed a weak directional trend for the altcoin.
Tron (TRX)
TRX witnessed a symmetrical triangle breakdown on 17 December while the fear sentiment surged. Since then, the alt steadily marked lower lows and lower highs until 23 December after oscillating in a down-channel (yellow).
After losing the crucial $0.078-level (four-month support), the bulls quickly reclaimed this mark but failed to cross the $0.082-level. They retested this level twice but succumbed to a broader sell-off. As a result, TRX saw a pullout, but the $0.078 still stood as good support.
Now, the Supertrend finally flipped into the red zone. At press time, TRX traded at $0.07857. The RSI constantly marked lower lows and struggled to sustain itself above the midline. The DMI flashed a bearish bais while the ADX swayed into the weak directional trend zone.
EOS
EOS saw a symmetrical triangle breakout over the last nine days. The bears retested the $3.09-level multiple times, but the bulls held their ground. Although they propelled an over 12% rally (from 20 December low) and breached the $3.4-mark, EOS saw a pullback from the 200 SMA (cyan).
The alt yet again found an oscillating range between $3.4 and $3.09 over the last 20 days. Now, the Squeeze momentum indicator flashed grey dots and hinted at a high volatility phase.
At press time, EOS was trading at $0.0. The RSI was near the oversold region after showing some comeback signs. Also, the Awesome Oscillator visibly depicted an increased selling influence.


