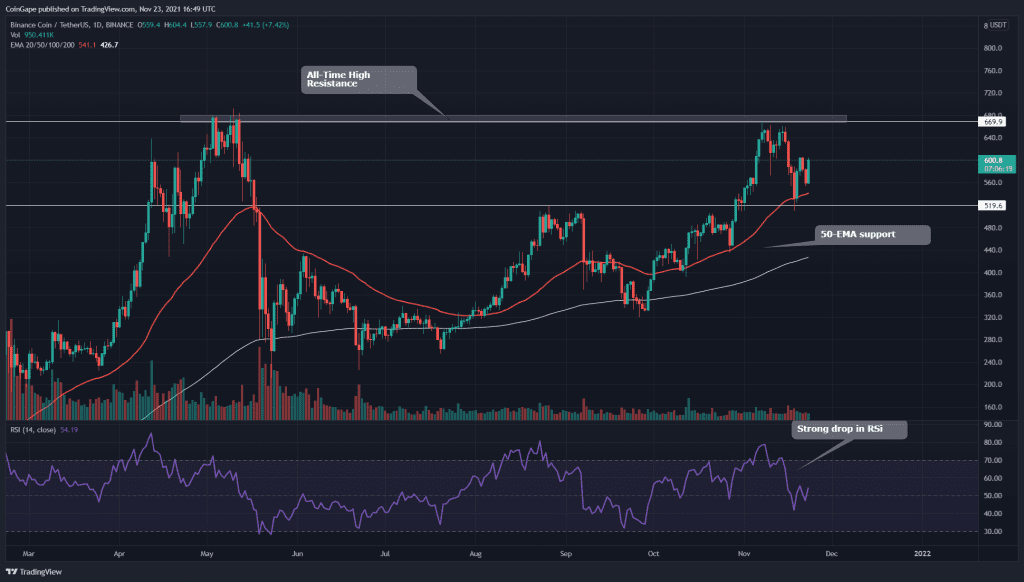
The BNB coin presents an overall uptrend in its technical chart. This coin has recently obtained good support from the $510 mark, and now it aims to breach the All-Time High resistance of the $670 mark. The crypto traders could wait for the price to give a decisive breakout from this level to expect a strong directional rally.
Key technical points:
- The BNB coin obtains dynamic support from the 50-day EMA line
- The daily RSI chart shows a striking drop concerning the coin’s price action
- The intraday trading volume in the BNB coin is $3.01 Billion, indicating a 36.1% gain
Source- BNB/USD chart by Tradingview
The BNB coin indicated an excellent opportunity for crypto traders when the price breached its previous swing high resistance of $520 on October 29th. The coin started rallying and retested the ATH resistance of $670 only to face strong resistance from this level.
Thus, the rally entered a correction phase, which dropped the price back to the $520 mark, this time to obtain proper support from it. The coin displays sufficient support from this level in order to resume this uptrend.
The exponential moving average(EMAs) confirms a bullish trend in the BNB coin, as its price is trading above the 20, 50, 100, and 200 EMA lines. Moreover, The Relative Strength Index(74) displays a significant drop in its RSI line, which must have stabilized the coin to continue its rally.
BNB/USD Chart In The 4-hour Time Frame

Source- BNB/USD chart by Tradingview
This lower time frame chart shows a steady rally in the BNB coin. Moreover, the coin price seems to be respecting the level of an ascending trendline leading this uptrend since late September.
Thus, crypto traders can use this support trendline to find good long entry opportunities. However, this will also serve as a great early signal if the price starts moving otherwise.
.
.
.
.


