Disclaimer: The findings of the following analysis are the sole opinions of the writer and should not be considered investment advice
Bitcoin has recorded losses of 16% in sixteen days. The market appears to be fearful once more, especially as BTC dropped below $40k. The Crypto Fear and Greed Index, at press time, stood at 20 to denote extreme fear. Even so, the market structure remains bullish on the higher timeframe charts.
Bitcoin could be primed to push towards $52k in the weeks to come. In fact, data from Coinglass showed that nearly $440 million dollars worth of positions, with $159 million of them on Bitcoin, were liquidated.
Bitcoin – 1 Day Chart
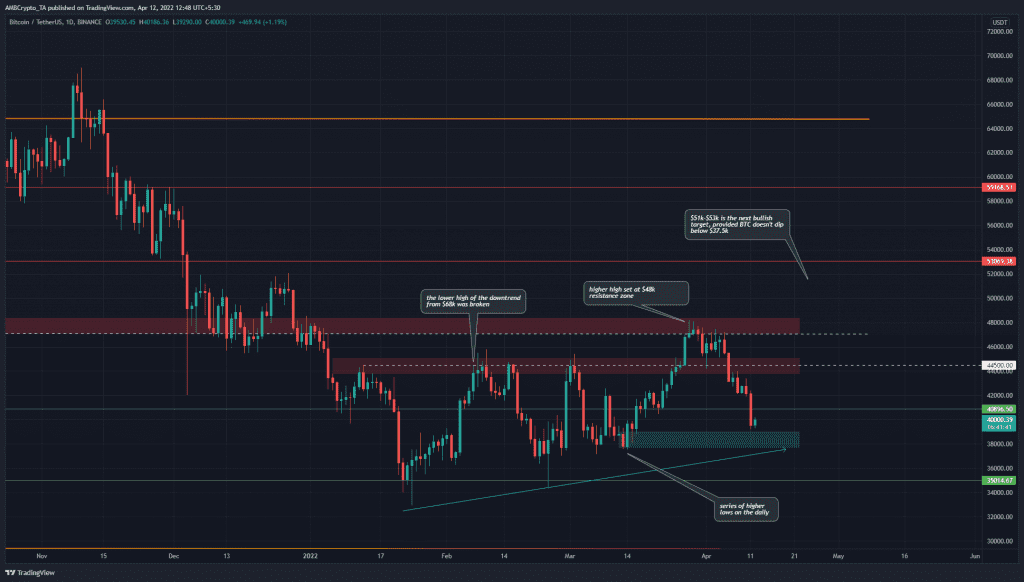
Bitcoin had been on a downtrend since November when the price posted a high of $69k. In mid-January, a swing low at $32.9k was seen. Since then, a lower low has not been set. Moreover, the downtrend’s lower high at $44.5k was beaten in early February and BTC registered a higher low thereafter at $34k.
These developments suggested that Bitcoin’s downtrend had ended. At press time, the market structure remained bullish. The cyan box at $38k represents a bullish order block, an area on the chart from where the price has seen a bullish impulse move.
In the next few days, it is possible for BTC to dip to this area and even as low as $37.5k to hunt for liquidity before a move upward. As things stand, BTC looks ready to climb higher once again, with $48k and $52k as heavy resistance zones to the north.
Rationale
The RSI did not suggest either a bullish or bearish trend in progress for the better part of the past two months. Especially as the momentum oscillated around the neutral 50 line. There was strong bullishness towards the end of March. This has now changed to strongly bearish as the RSI dropped to 37.5.
The Awesome Oscillator also dropped beneath the zero line. It has been flashing red bars on its histogram over the past couple of weeks to denote rising bearish momentum.
The OBV, on the other hand, has been on an uptrend since mid-January. The lack of a significant dip in the OBV over the past week shows that a move towards $37.5k would likely be for buying.
Conclusion
Despite the fear in the market, the technicals looked fairly good for Bitcoin’s bulls. The price chart showed the bullish structure of the past two months is still intact. Unless BTC drops below $37k-$37.5k, the bulls will have the upper hand.


