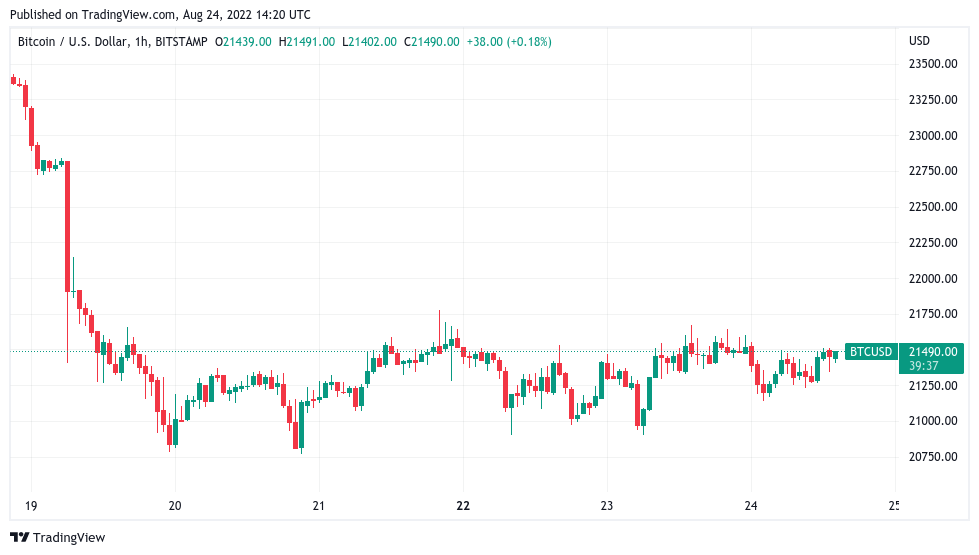
Bitcoin (BTC) stayed strictly rangebound on Aug. 24 as buyers and sellers attempted to spark a breakout.
Spot price squeeze on the cards
Data from Cointelegraph Markets Pro and TradingView showed BTC/USD hovering near $21,500 at the Wall Street open.
The pair had seen little action in the 24 hours prior, entering the fifth day of sideways movement within an increasingly tight range.
Data from the order book of major exchange Binance uploaded to social media by on-chain monitoring resource Material Indicators hinted that the status quo was frustrating exchange users, including whales.
At the time of writing, bids were inching higher towards spot price, while seller interest was building at $21,600.
The result could be volatility as liquidity reduces the range in which BTC/USD floats — either to the upside or downside, depending on whether buyers or seller win out.

“Really not much has changed since yesterday, I am still looking for that one leg down to take out the swing lows, followed by a relief wave,” popular trader Crypto Tony meanwhile told Twitter followers in an update on the day.
Fellow trader Crypto Ed meanwhile said that he was “not convinced” about the strength of the bounce from the weekend lows around $20,800.
In his latest YouTube video, he highlighted potential market entry levels between those lows and the current spot with an eye to seeing a retest. Before that, he added, Bitcoin could revisit the range highs at just above $22,000.
Dollar creeps back towards two-decade peak
Stocks meanwhile added to the sense that a risk asset resurgence could characterize the day.
Related: Bitcoin bulls may win big as two key moving averages prepare to cross
The S&P 500 and Nasdaq Composite Index both headed higher at the Wall Street open, leading Cointelegraph contributor Michaël van de Poppe to eye knock-on effects for BTC/USD.
#Nasdaq bouncing upwards, while #Bitcoin looks primed for a break above $21.5K.
— Michaël van de Poppe (@CryptoMichNL) August 24, 2022
Popular Twitter account Game of Trades contributed a longer-term bullish view for U.S. equities, noting that 90% of S&P 500 stocks were now above their 50-day moving average.
“This reading has presented investors with jaw dropping returns in a 6–12 month time frame. Load up,” he advised followers.
A possible headwind came in the form of the U.S. dollar. After dropping swiftly on the back of U.S. manufacturing data, the U.S. dollar index (DXY) canceled out its losses on the day, heading back toward new twenty-year highs.

The views and opinions expressed here are solely those of the author and do not necessarily reflect the views of Cointelegraph.com. Every investment and trading move involves risk, you should conduct your own research when making a decision.


