Bitcoin (BTC) reached a new 2022 low of $38,250 on Jan 20. While it’s still trading at a considerable support area, there are no bullish reversal signs in place yet.
BTC has been falling since reaching an all-time high price of $69,000 on Nov 10, 2021. While it initially bounced on Jan 10, it failed to sustain its upward movement and broke down below $40,000 on Jan 21. So far, it has reached a local low of $38,250.
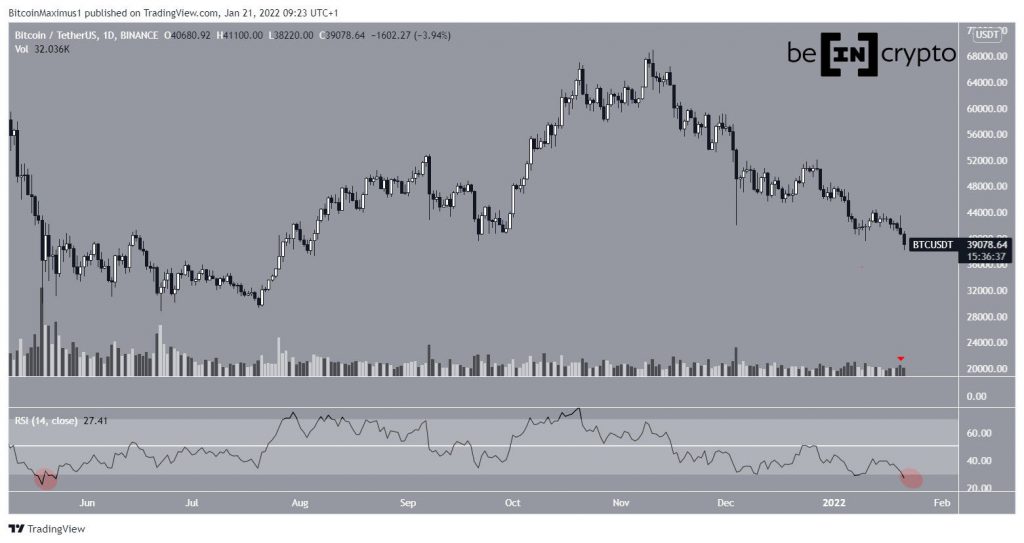
Technical indicators are showing that the downward move is losing steam. The first indicator of this is the volume (red icon), which is below average considering the BTC price has made a new yearly low.
The second sign can be seen in the daily RSI, which has fallen below 30. The RSI is a momentum indicator and readings below 30 are normally considered oversold.
The previous time the RSI was this oversold was in May when the BTC price was close to $30,000. A significant upward movement followed after.
Support levels
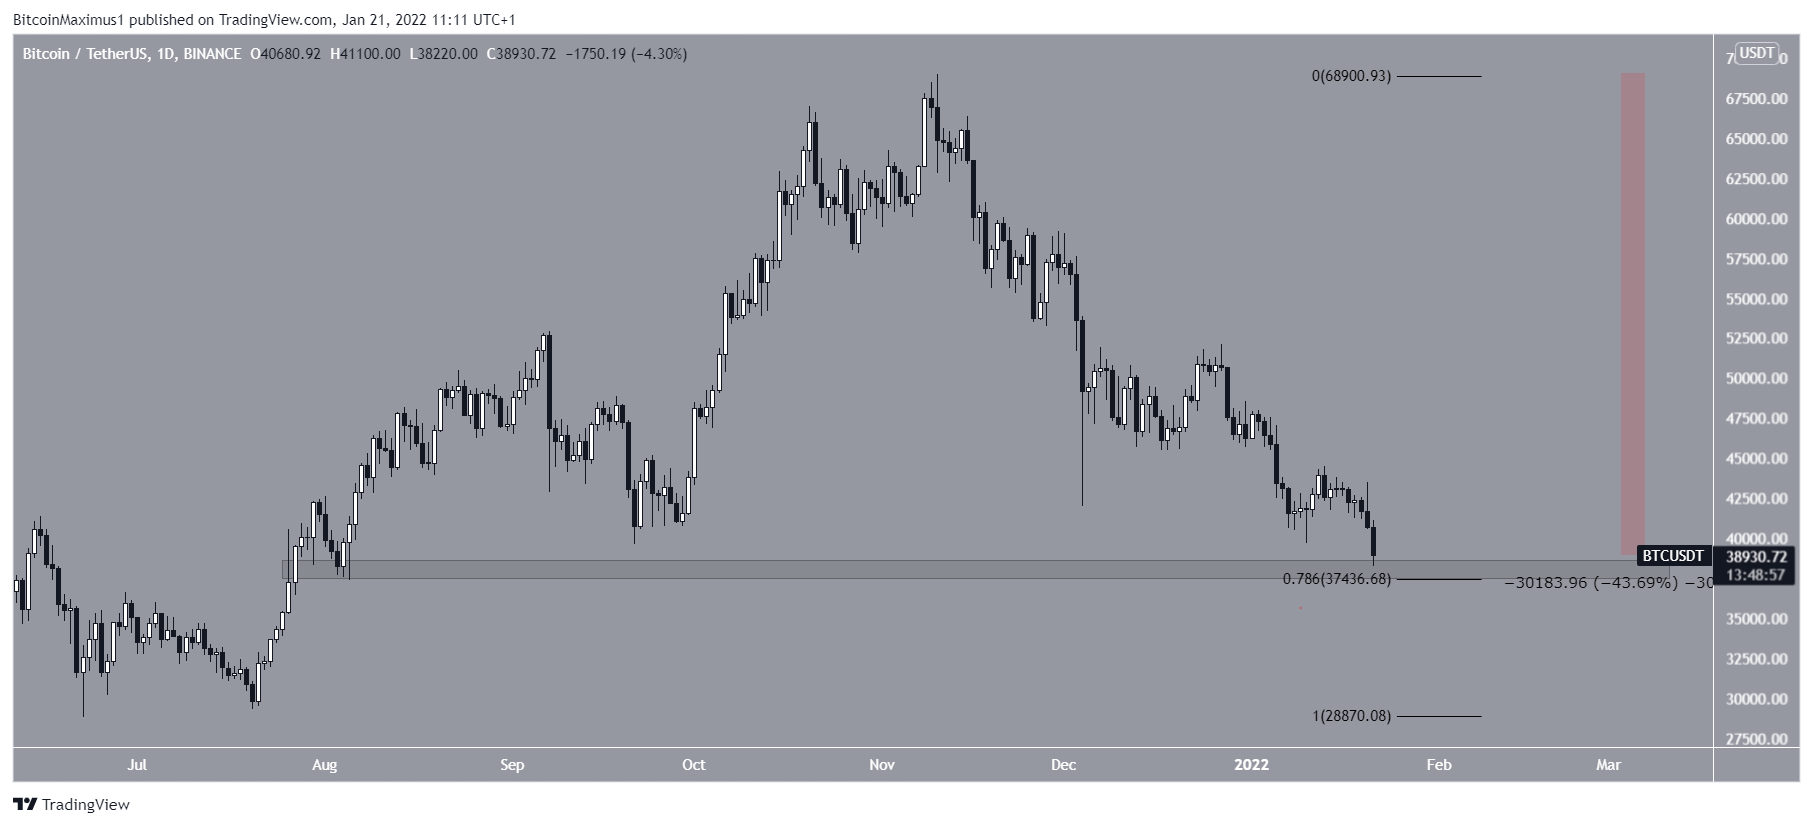
So far, BTC has decreased by 43.7% measuring from the all-time high price. Such significant falls without a retracement have historically been uncommon for BTC.
In addition to this, the price is trading just above the $38,000 horizontal support area, which coincides with the 0.786 Fib retracement level at $37,450.
Future BTC movement
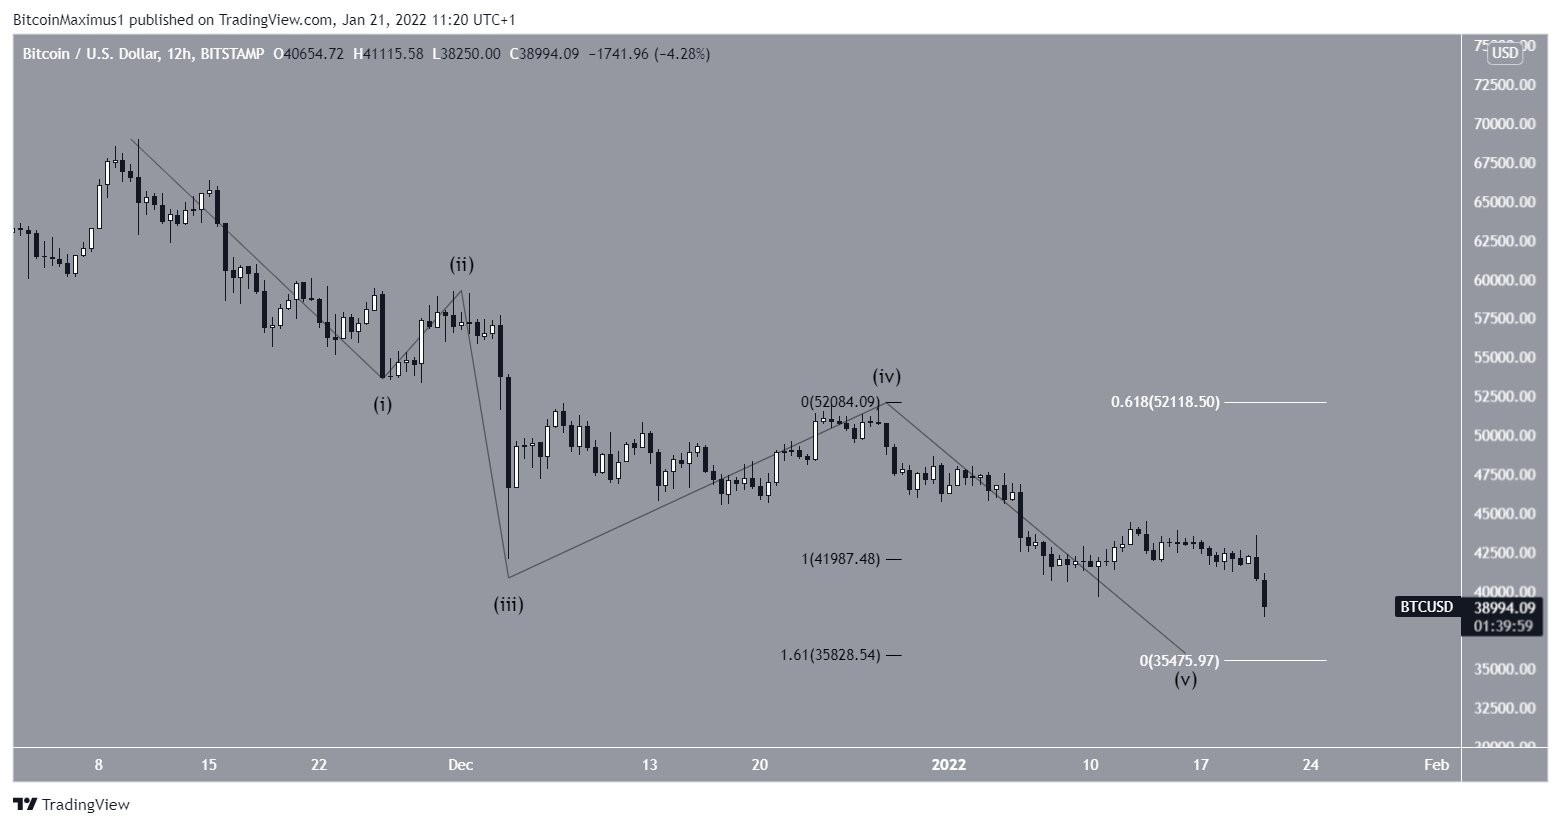
The downward movement measuring from the highs seems to have formed a five-wave corrective pattern. If so, BTC appears to currently be in wave five of this decrease (black).
The area with the most confluence of supports is found between $35,000-$35,800. This range is found using the 1.61 external Fib retracement resistance level (black) on wave four and the 0.618 length of waves 1-3 (white).
Therefore, it’s possible that this area will act as the low of the entire pattern.
For BeInCrypto’s latest Bitcoin (BTC) analysis, click here.
Disclaimer
All the information contained on our website is published in good faith and for general information purposes only. Any action the reader takes upon the information found on our website is strictly at their own risk.


