Bitcoin (BTC) has been moving downwards since Nov 10 and is approaching its 2021 lows. Despite indicators showing extremely oversold readings, there are no bullish reversal signs in place yet.
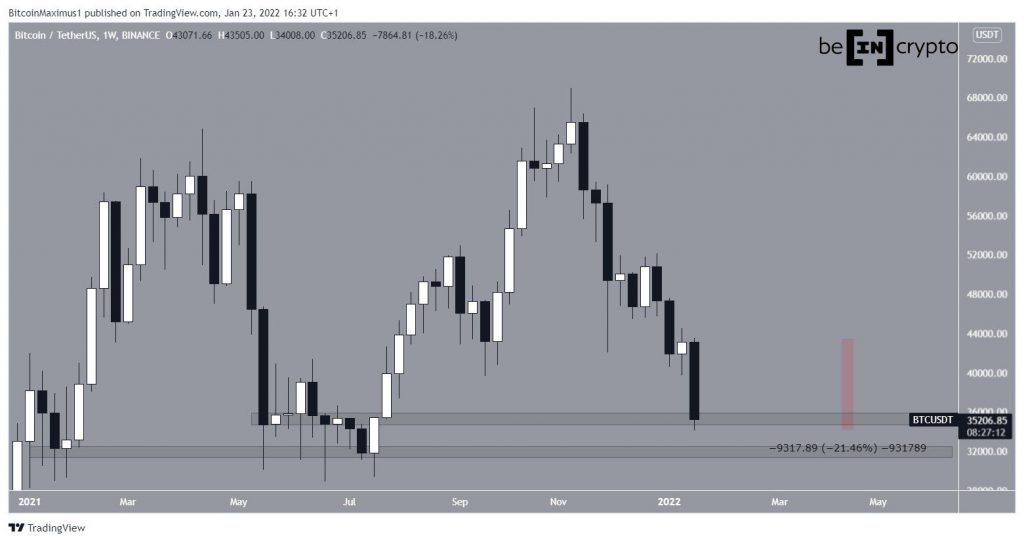
Bitcoin decreased considerably during the week of Jan 17-24, at one point falling by 21.5% when measuring from the highest to the lowest price. The entire range of movement transpired between $43,500 and $34,000.
The exact support levels are not precisely clear due to the presence of numerous wicks. However, the two most likely support areas seem to be at $35,200 and $32,000.
At the time of press, BTC is trading inside the former.
Oversold technical indicators
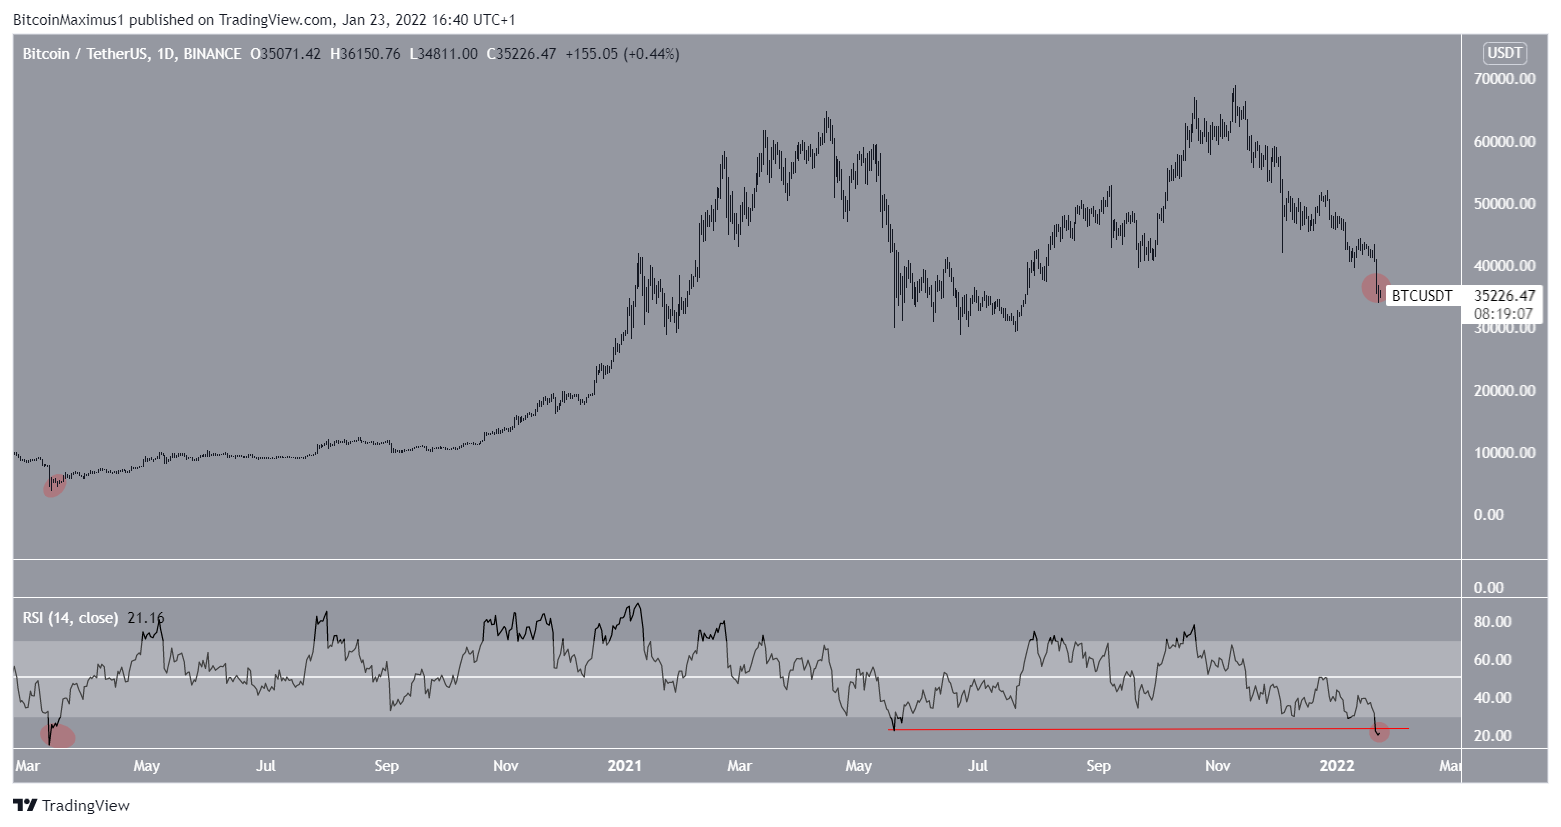
Technical indicators in the daily time frame do not yet show any signs of a reversal, such as a developing bullish divergence.
However, the RSI reached a low of 20 on Jan 22. The RSI is a momentum indicator and readings below 30 are considered oversold. The 20 reading is lower than that of May 2021, when the BTC price had reached the 2021 bottom in July.
Interestingly, the RSI has not been this oversold since March 2020 (red circle), at the absolute bottom of $3,300. Therefore, according to this indicator, a bottom is likely to be close.
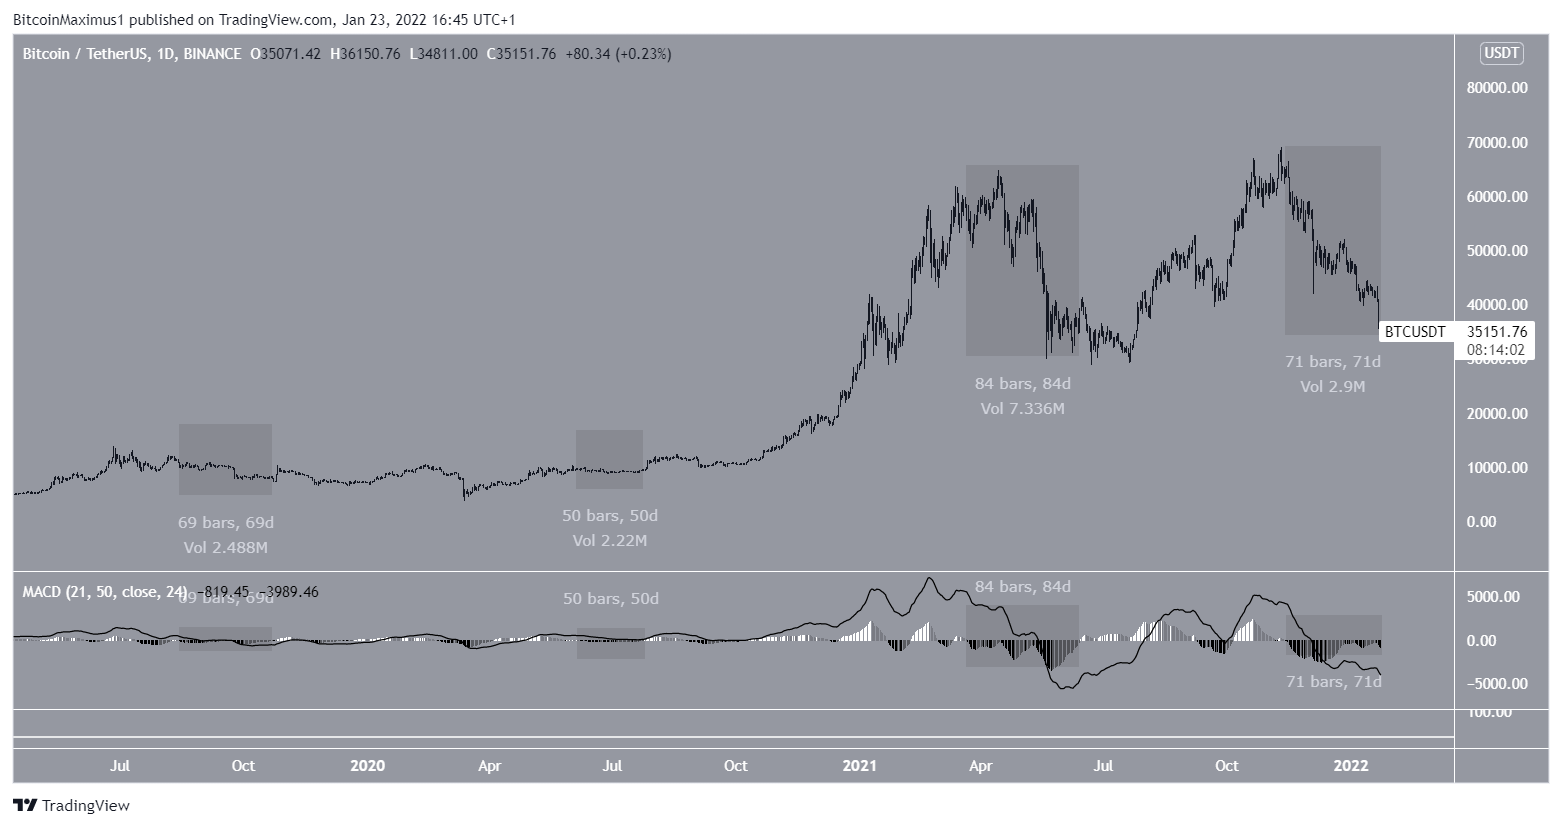
A similar reading is given by the MACD, which is an indicator created by short and long-term moving averages (MA). The MACD has been negative for 71 days and counting. This means that the short-term MA is moving slower than the long-term average.
Since 2019, the longest periods of time in which the MACD has been negative have been 69, 50, 84, and 71 days (highlighted in the chart below), respectively.
Therefore, the current period is the second-longest time in which the MACD has been negative, trailing only that of April-June 2021.
Short-term BTC movement
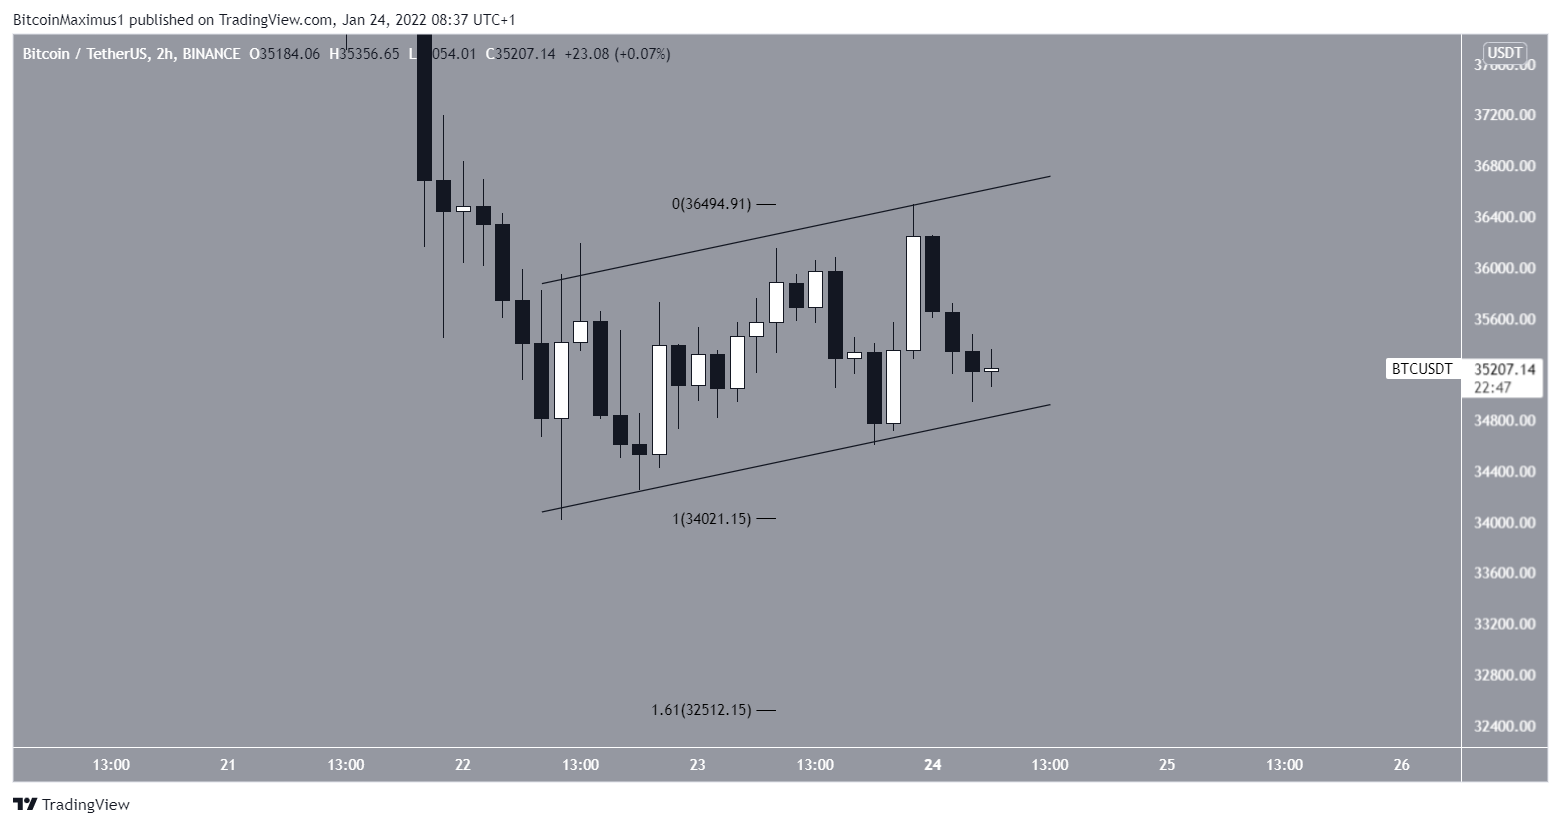
The two-hour chart shows that BTC is trading inside an ascending parallel channel since Jan 22. Such channels often contain corrective movements, meaning that an eventual breakdown from it would be likely.
If this occurs, the next closest support area would likely be found at $32,500. This target is the 1.61 external Fib retracement level when measuring the height of the channel.
This would also coincide with the previously outlined long-term support area near $32,000.
For BeInCrypto’s latest Bitcoin (BTC) analysis, click here.
Disclaimer
All the information contained on our website is published in good faith and for general information purposes only. Any action the reader takes upon the information found on our website is strictly at their own risk.


