Bitcoin (BTC) is trading inside a short-term bullish pattern and has generated bullish divergences in multiple time frames.
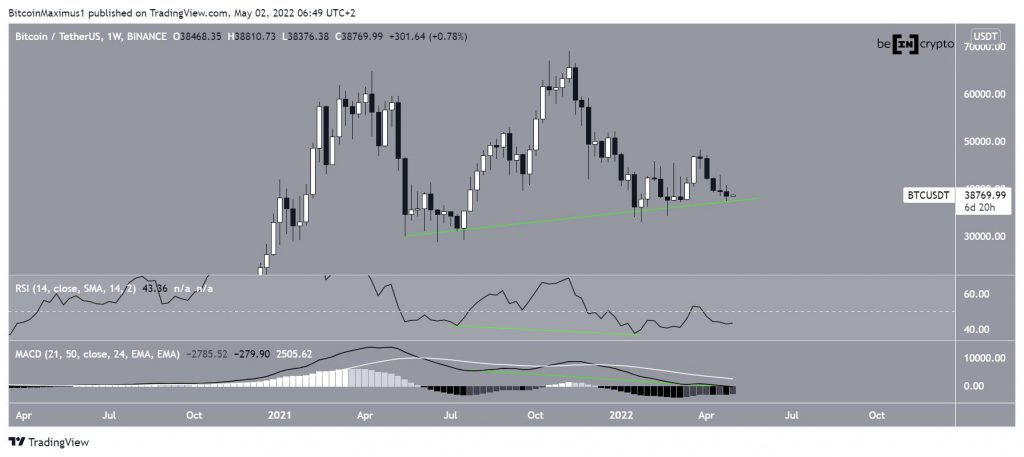
The weekly chart shows that BTC created a small bearish candlestick during the week of April 25-May 1. The candlestick was created in the same range that the price has been trading in since the beginning of 2022.
Technical indicators are showing mixed signals. The initial reading can be seen as bearish since the RSI and MACD are both falling. Additionally, the RSI is below 50 and the MACD is negative.
Nevertheless, both the RSI and MACD have generated hidden bullish divergences. Such divergences are often considered signs of trend continuations. Their occurrence in the weekly time frame is uncommon and would be expected to lead to a significant upward movement.
Finally, it’s possible that BTC has been trading above an ascending support line since the April 2021 lows (green line).
Will BTC break out?
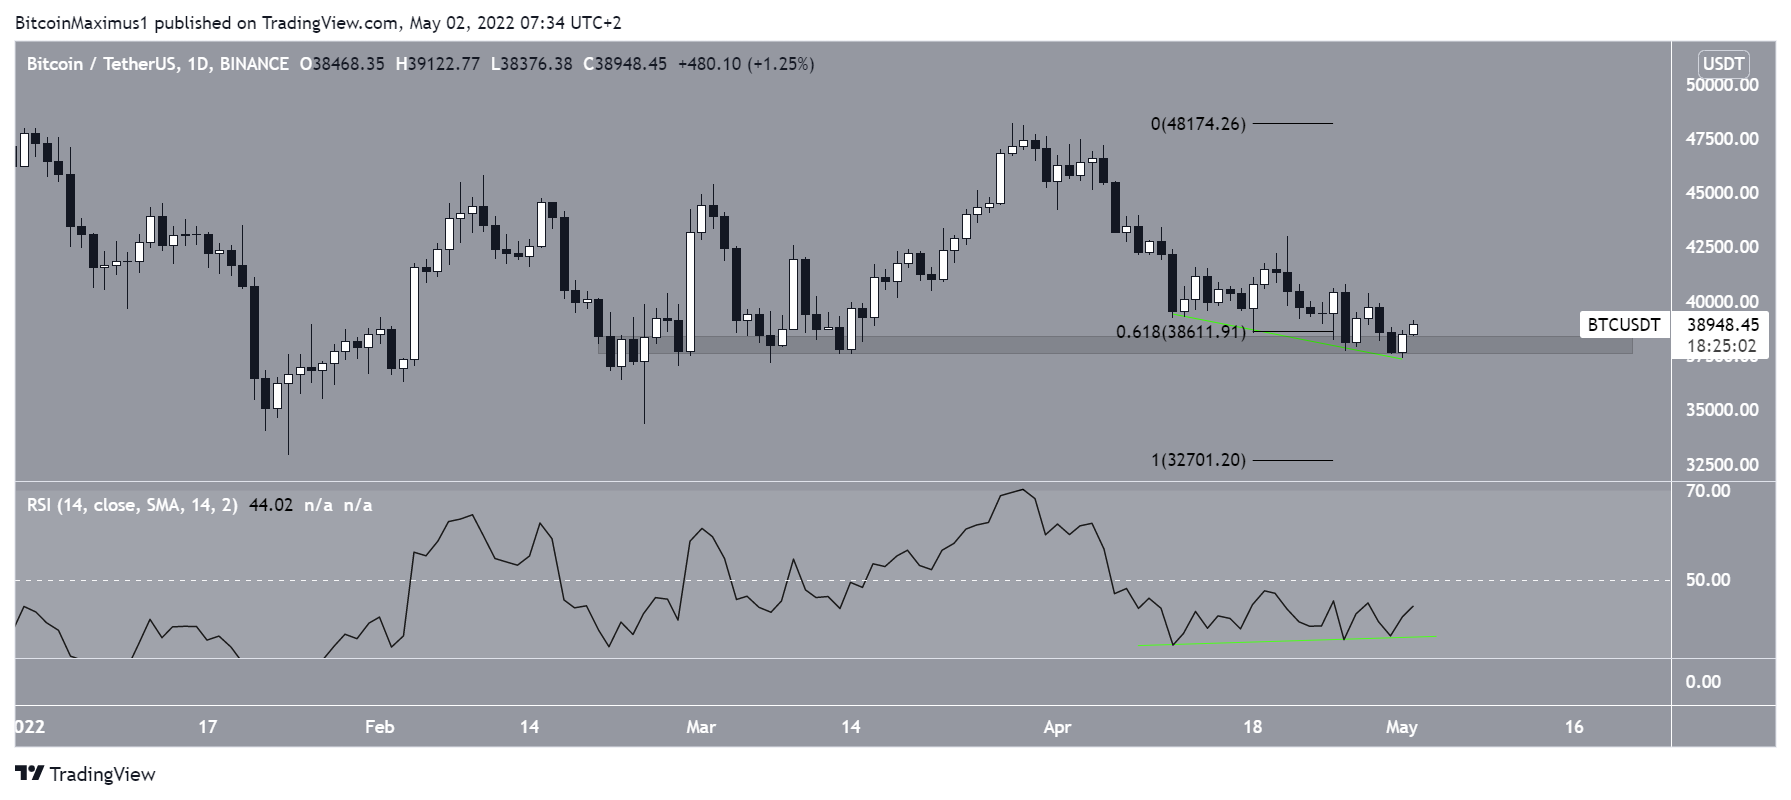
The daily chart shows that BTC has been falling since March 28. The decrease led to a low of $38,376 on May 1.
The price rebounded at the $37,500 horizontal support area after this and is currently in the process of reclaiming the 0.618 Fib retracement support level at $38,600. This would be a bullish development because, in that case, there would be strong support between $37,500 and $38,600.
Similar to the weekly time frame, the daily RSI has also generated a bullish divergence (green line).
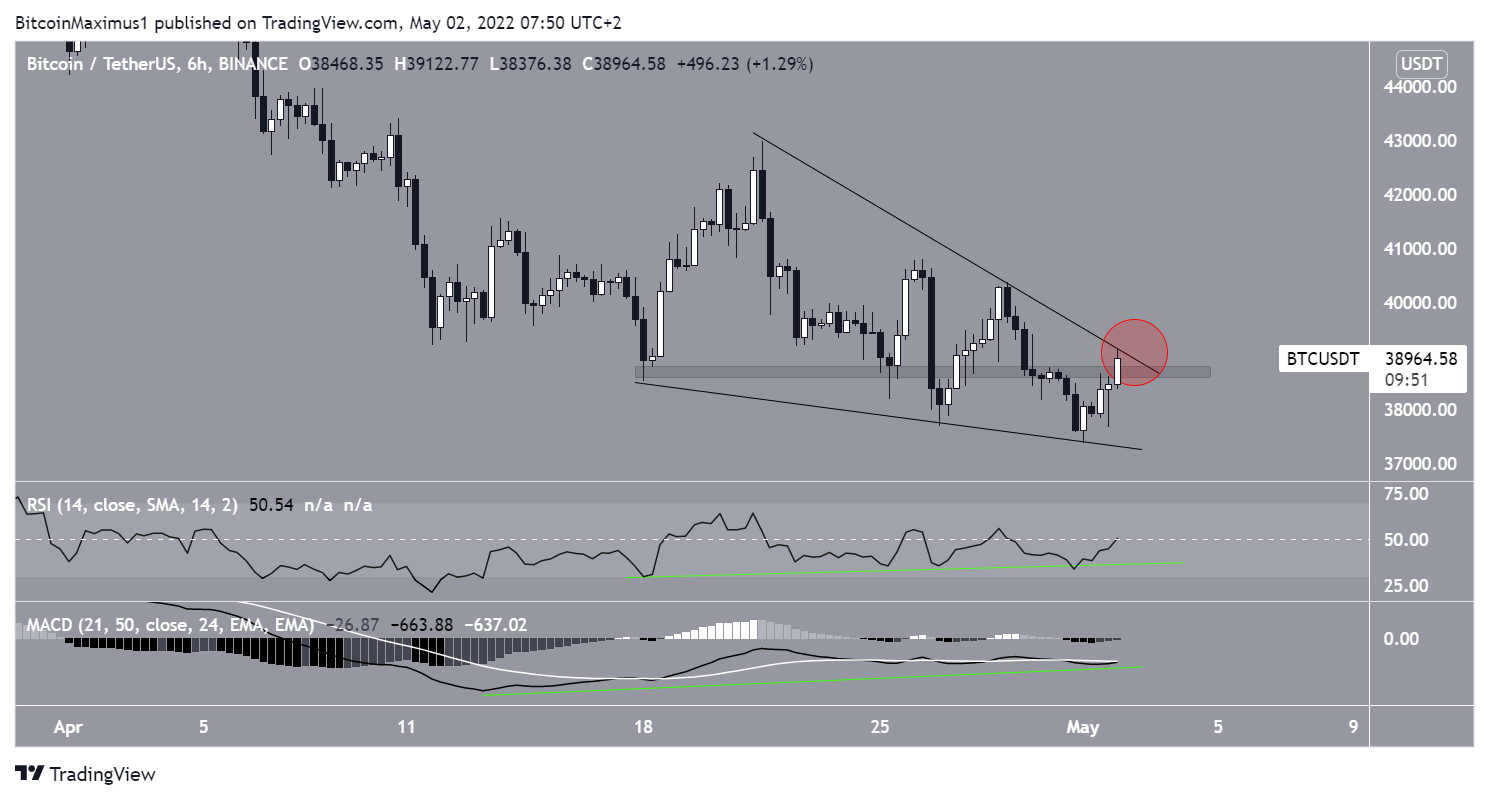
The six-hour chart also shows that BTC has been trading inside a descending wedge since April 17. The descending wedge is considered a bullish pattern, meaning that a breakout from it would be the most likely scenario.
Currently, BTC is trading at the resistance line of the wedge and the minor $38,600 resistance area. The area previously acted as support and has now turned to resistance. Therefore, this is a crucial resistance level that could trigger a sharp upward move if BTC manages to break out.
Similar to both the weekly and daily time frames, there is a pronounced bullish divergence in the six-hour time frame. In this case, the divergence is also visible in the MACD, increasing its significance.
Both the price action and technical indicators suggest that a breakout from the wedge is likely.
Wave count analysis
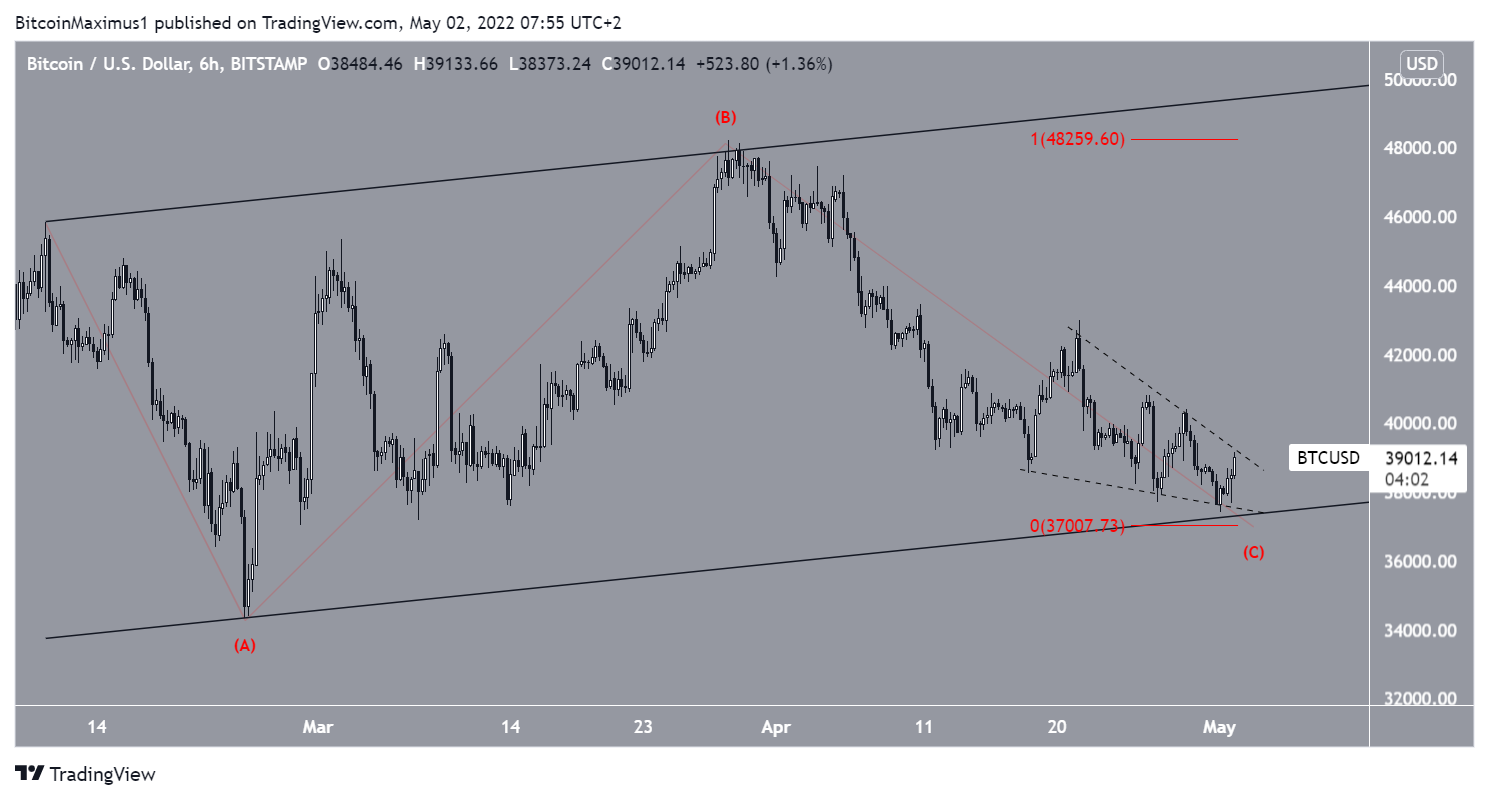
The most likely wave count suggests that BTC has completed or is very close to completing the C wave of an A-B-C corrective structure.
Waves A and C have now made a 1:1 ratio and the entire movement has been contained inside an ascending parallel channel, increasing the possibility that the wave count is correct.
This breakout fits with the price action, indicators readings, and the long-term wave count.
For BeInCrypto’s previous Bitcoin (BTC) analysis, click here
Disclaimer
All the information contained on our website is published in good faith and for general information purposes only. Any action the reader takes upon the information found on our website is strictly at their own risk.


