The world’s largest cryptocurrency Bitcoin (BTC) witnessed a brutal crash last week along with the collapse of the Terra ecosystem. Since then, the Bitcoin price has been flirting around $30,000 but has failed to give a daily close above it.
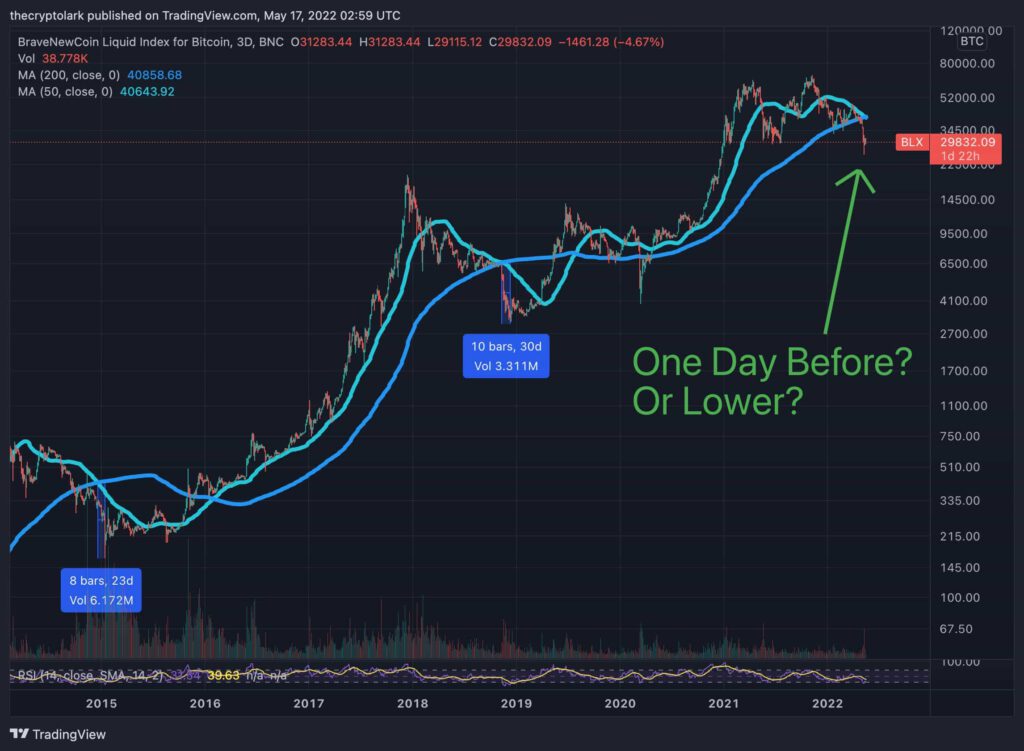
A major red sign on the technical charts is that Bitcoin has crossed a 3-day red chart! The last two times this happened, the BTC price corrected by a staggering 50%. If Bitcoin repeats this performance, we are heading all the way down to $15,000. Popular crypto analyst Lark Davis writes:
Interesting observation on the Bitcoin 3 day death cross. The last two times, the bottom was reached 6 days and 10 days after the cross. Did we reach the low one day before cross this time? Or one more crash? *** lagging indicator, past performance does not indicate future.
Amid the recent market correction, there’s a huge inflow of BTC at the exchanges. As on-chain data provider Glassnode explains: “Bitcoin Number of Addresses Sending to Exchanges (7d MA) just reached a 4-year high of 7,918.940 Previous 4-year high of 7,903.512 was observed on 13 May 2021”.
Trending Stories
Furthermore, the RSI chart shows that Bitcoin isn’t oversold anytime at this point. Thus, investors might want to wait for some more time before chipping in.
Bitcoin Accumulation Continues
On-chain data provider Glassnode reported that during the major price correction last week, the BTC accumulation continued. Glassnode presented an Accumulation Trend Score, the value of which reached closer to 1. The on-chain data provider writes:
On Thursday 12-May, when the market was at the lowest, the Accumulation Trend Score reversed from very weak values below 0.3, to return values upwards of 0.796. Supporting the Bitcoin price bounce back into the $30ks, the Score returned values above 0.9 for the remainder of the week, suggesting strong buy side activity took place.

However, Glassnode explains that small holders with <1 BTC were the biggest accumulators. However, investors holding 100 BTC to 10k BTC showed overall weakness in the net accumulation.


