Today’s on-chain analysis for Bitcoin looks at two independent indicators that seem to be generating the same bullish reversal signal. Their confluence could soon lead to a macro bottom for the BTC price.
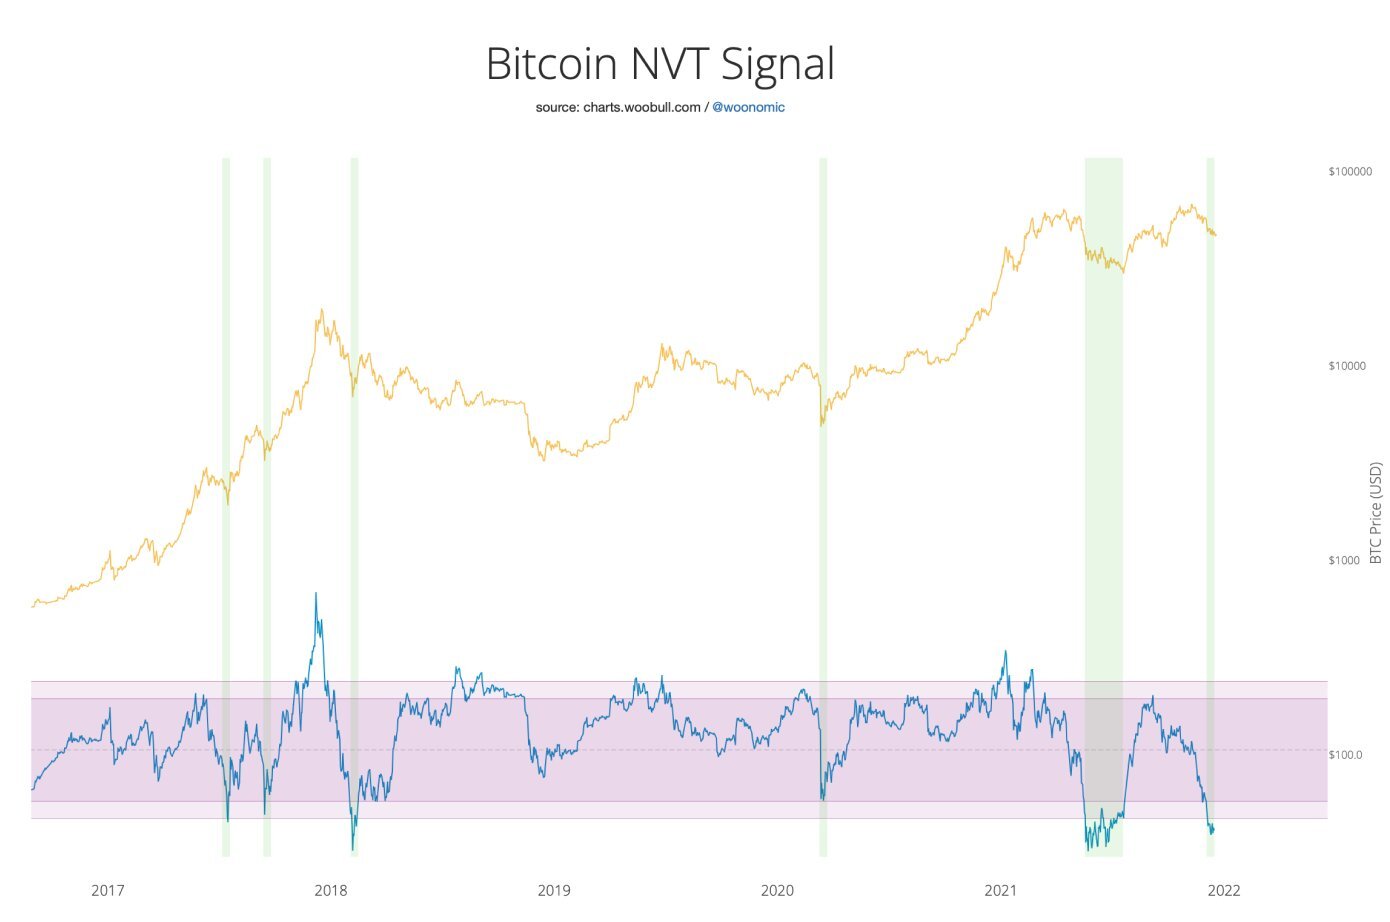
The first is the NVT Signal, which is an equally old and effective on-chain indicator. It has proven particularly effective when it has reached the “oversold” territory that has historically correlated with Bitcoin macro lows.
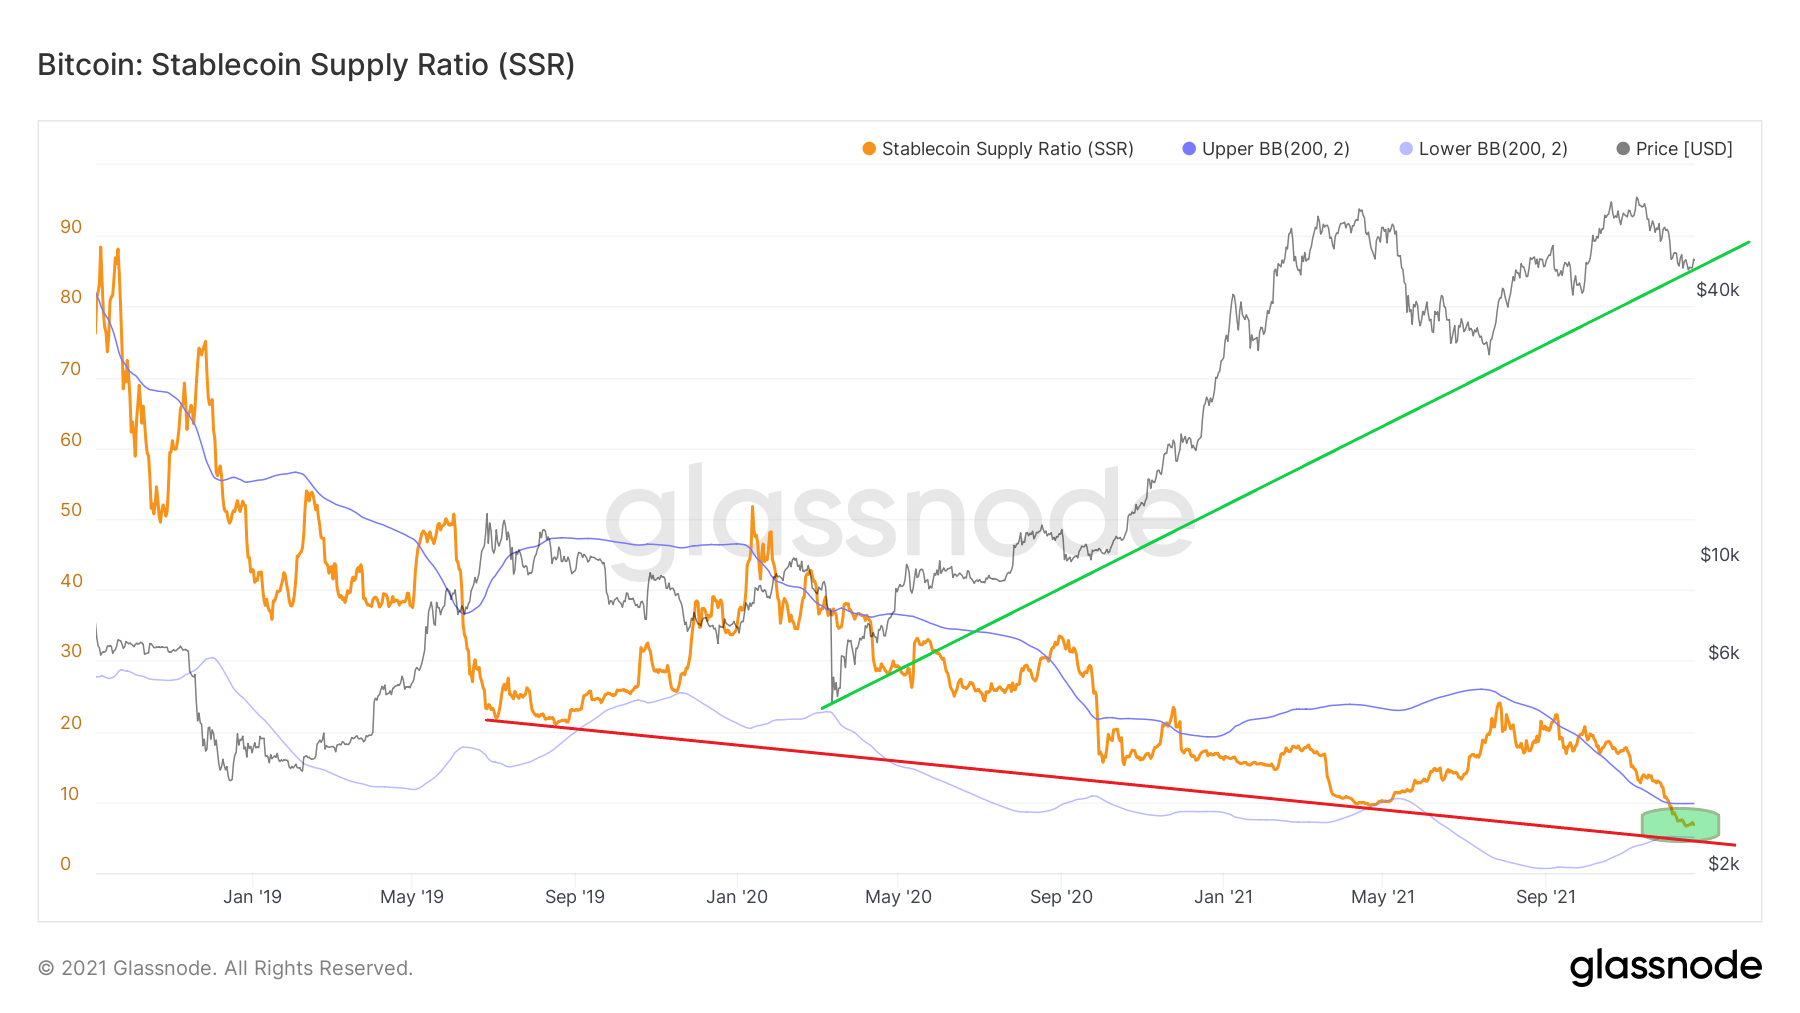
The second is SSR, which measures the purchasing power of stablecoins against BTC. It has reached an all-time low during this correction, and the purchasing power of stablecoins is approaching record highs.
Bitcoin NVTS reaches oversold level
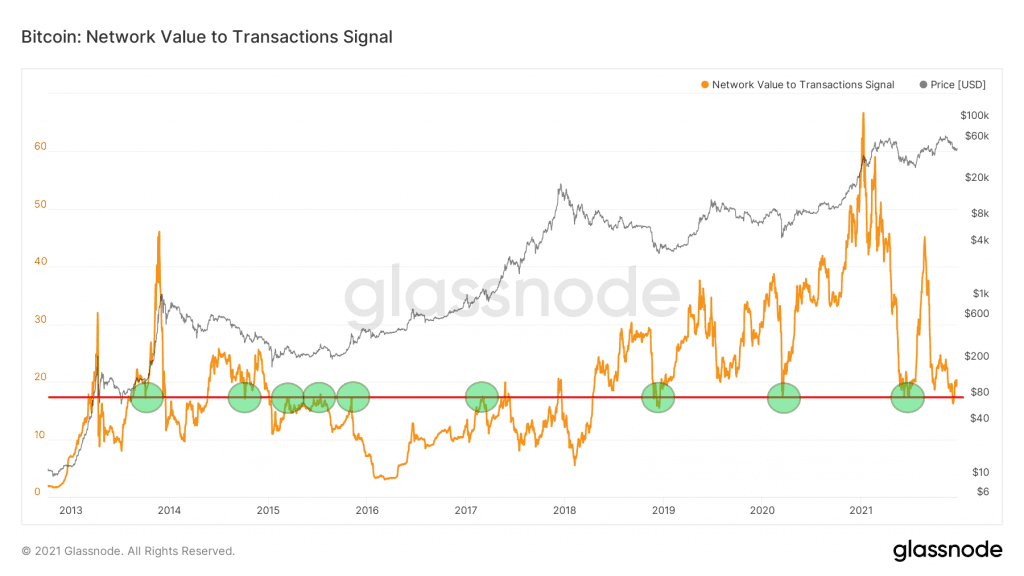
NVT Signal (NVTS) is a modified version of the original NVT Ratio indicator. The latter is calculated by dividing market capitalization by transferred on-chain volume measured in USD. In contrast, NVTS uses a 90-day moving average of daily transaction volume in the denominator instead of raw daily transaction volume. This improves the reading to better function as a leading indicator.
The long-term NVTS chart shows the importance of the area near the 17.5 value (red line) from which the indicator has just bounced. This area provided support during the 2021 summer correction. It had previously reached exactly the same level during the COVID-19 crash in March 2020 and at the very bottom of the bear market in December 2018.
Interestingly, the same area around 17.5 acted as resistance multiple times in 2015. Even before that, just before the second phase of the violent bull market of 2013, NVTS also found support.
One of the most popular on-chain analysts, @woonomic, calls NVTS the “granddaddy” of on-chain indicators, but insists that it “still works.”
In a recent tweet, he pointed out that historically it hasn’t given a very frequent reading of being “oversold” on a chart he designed himself. All the periods when NVTS fell to support (light pink) coincided with BTC price lows (green area).

Stablecoin buying power is increasing
If NVTS is indeed currently giving a bullish signal and the Bitcoin price correction were to end soon, the price of BTC should be expected to rise. For this to happen, funds must flow into the market with which potential purchases could be made.
Last week, BeInCrypto’s on-chain analysis highlighted a Stablecoin Supply Ratio (SSR) that was approaching the all-time low (ATL). Today, in fact, the SSR is at a record low (green area). This means that the purchasing power of stablecoins (USDT, TUSD, USDC, USDP, GUSD, DAI, SAI, and BUSD) is increasing relative to BTC.

Furthermore, we notice two (non-ideal) trend lines on the chart. The green uptrend line relates to the BTC price, which has been rising since the March 2020 bottom. The red downtrend line relates to the SSR and has been in place since July 2019. Note that its decline indicates an increase in stablecoin purchasing power. If the positive correlation between the increasing purchasing power of stablecoin and the price of BTC is maintained, we can expect the two trends to continue.
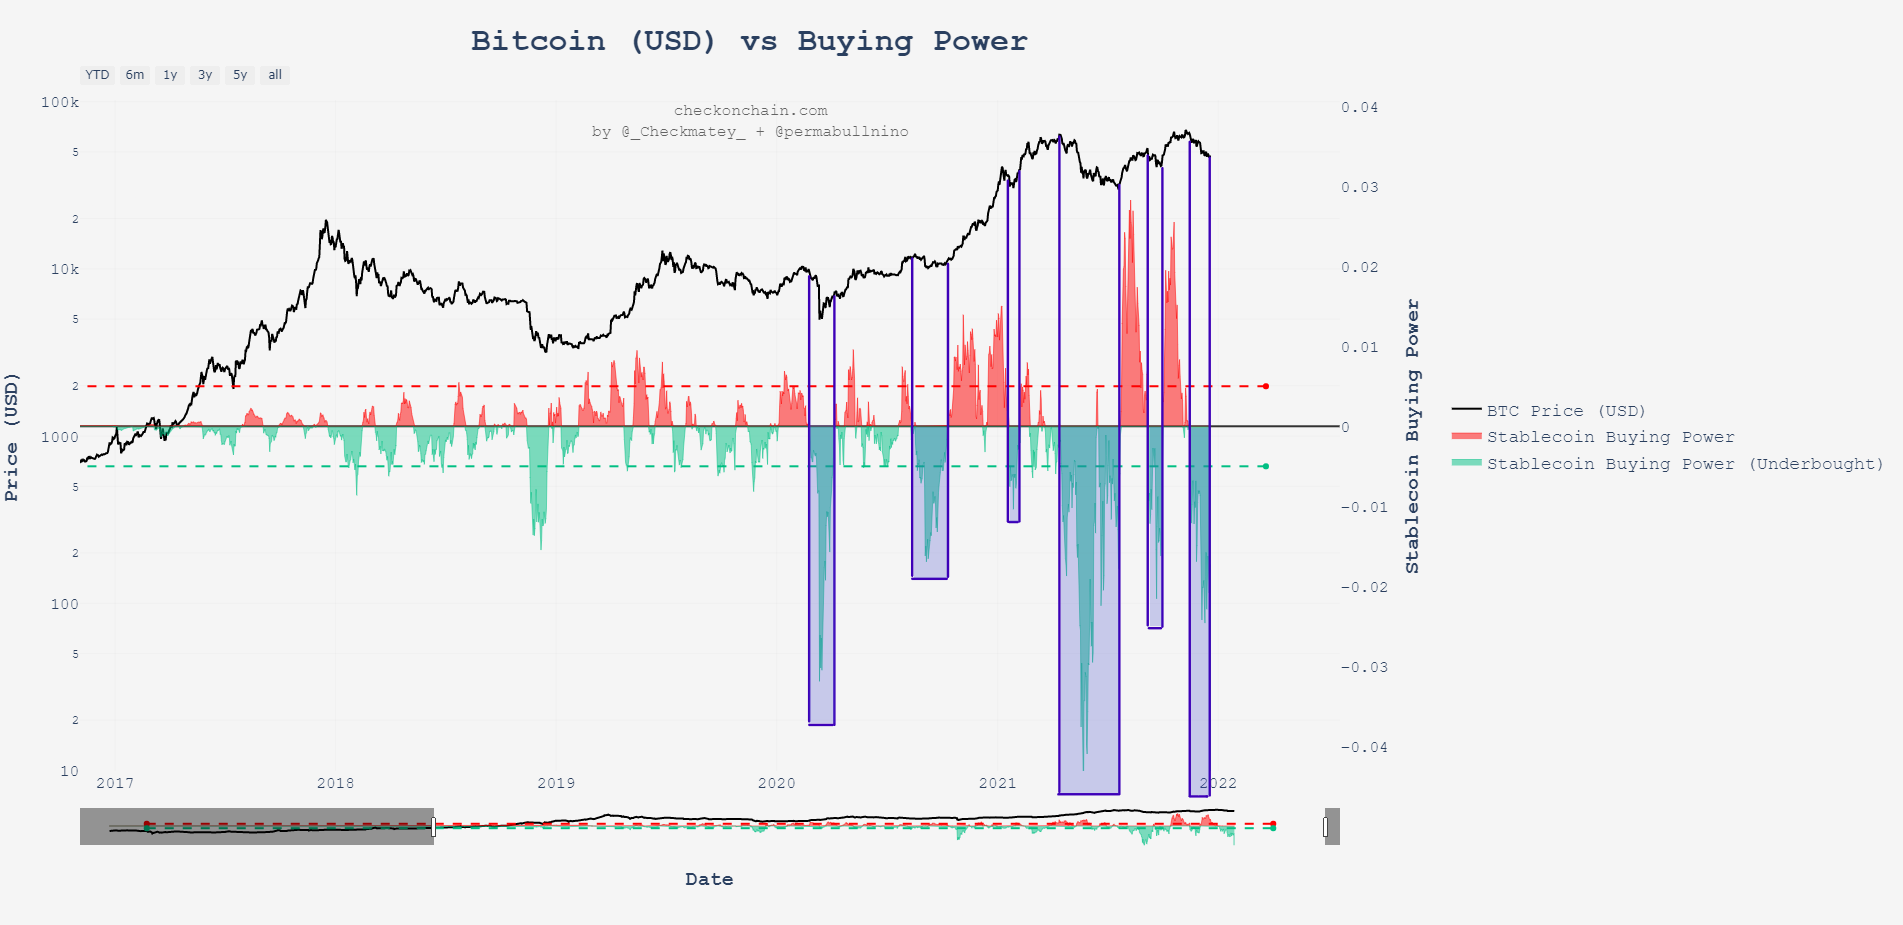
The importance of the green area in the chart above is also highlighted by the analogous stablecoin buying power chart prepared by two on-chain analysts @_checkmatey_ and @permabullnino. In the long-term chart, we see green bars that indicate areas where stablecoin purchasing power has been increasing.
We have highlighted periods of strong growth in this trend in purple to show the correlation with the BTC price. This turns out to be negative. Periods of a strong rise in stablecoin purchasing power have historically coincided with clear corrections in the Bitcoin price.

This is no different during the current correction, which points to the second-largest increase in the purchasing power of stablecoins. The current trend is second only to the deeper correction of May-July this year.
The juxtaposition of the two indicators of today’s on-chain analysis gives a strong indication in favor of the thesis that bitcoin is in the process of reaching a macro bottom. Historically, both indicators at their current values have been bullish signals, after which the Bitcoin price rose dynamically.
For BeInCrypto’s latest Bitcoin (BTC) analysis, click here.
Disclaimer
All the information contained on our website is published in good faith and for general information purposes only. Any action the reader takes upon the information found on our website is strictly at their own risk.


