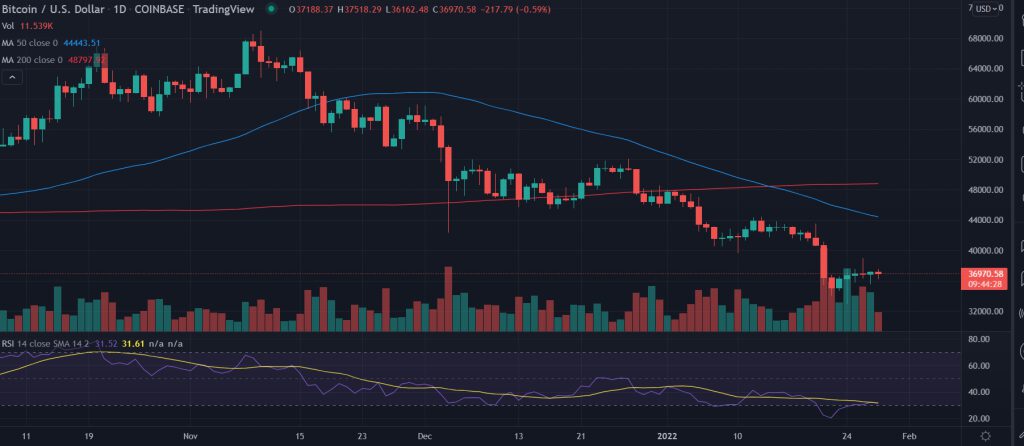
The correlation between BTC and US Tech stocks has tightened since 2020 as per the research. Bitcoin’s (BTC ) price has recovered from multi-month lows near $32,933.33 from the beginning of the week. However, it has been trading in a tight range with no clear direction. Bitcoin bulls have taken the backseat.
- BTC continues to struggle on Friday following the global financial market meltdown
- Further, the BTC supply percentage by long-term holders peaked new highs since Match 2020.
- The recent data shrugs off US hawkish stance indicating some discount buying in the digital currency.
At the press time, BTC/USD is trading at $36,750, down 1.12% for the day. The 24-hour trading volume of $25,549,381,103 with market cap of $697,792,638,594.
Bitcoin worth $670 million left the centralized exchange
Glassnode, the on-chain Data, and intelligence platform revealed that more than 18,000 bitcoin worth $670 million left centralized exchanges on Thursday, the biggest single-day net outflow in over a month.
On the daily chart, the Bitcoin (BTC) price has encountered the death-cross near on January 15 near $48,000. The BTC/USD pair has retreated almost 31% toward the recent lows of $32,933.33.
The daily relative strength index (RSI) is at 30 is about to give a bullish crossover. Any uptick in the indicators would result in the upside momentum in BTC/USD.
The demand zone near the current levels could see the upside to $44,000. This also coincides with the 50 DMA. Next, market participants could meet the 200 DMA at $48,000.
Alternatively, if the price could not sustain the recent lows then the July lows around $29K.
Furthermore, the strength in the US dollar index (DXY) kept the pressure intact on the digital currency.


