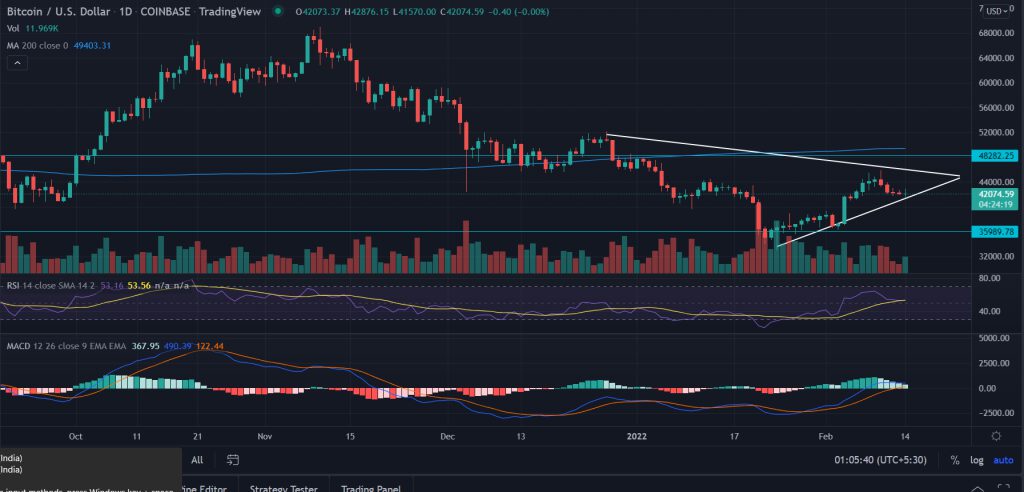
Bitcoin (BTC) price gains modestly in a lukewarm trading environment. BTC has been locking gains from January’s low of $32,933.33. While recording an upside of 28%. However, the price retreated after forming a ‘double top’ formation near the swing highs of $45,500.
- Bitcoin (BTC) price continues to consolidate on Monday.
- BTC needs to break the trading range to avoid another week of sideways movement.
- A decisive break below $42,000 will bring more downside in the pair.
The Bitcoin bullish narrative being tested this week as geopolitical tension between Ukraine and Russia and the possibility of a Federal Reserve interest rate hike by 50 basis points in March weighed upon the largest cryptocurrency.
Furthermore, the price of bitcoin has dropped from the 2022 highs and nearly 38% from its November all-time high.
Bitcoin moves sideways inside a Symmetrical triangle
On the daily chart, after rallying above $45,500 from January’s lows, BTC/USD has since dropped back into the range that has to be broken by strong volumes to set a fresh directional base. Bitcoin is at a relative equilibrium level with clear zones of resistance and support above and below.
The formation of the Symmetrical triangle indicates bulls lack conviction near the upper trend line that merges with the recent swing highs. Expect more sideways movement as BTC crawls near the ascending trend line.
Investors wait for a decisive breakout toward the inflection point. A resurgence of the bullish pressure could push the price into a higher trajectory while aiming for the 200-EMA (Exponential Moving Average) at $49,343.
Next market participants would seek to recoup the psychological $52,0000 level.
On the other hand, a lower breakout could explore the $36,000 horizontal support level.
Technical indicators:
RSI: The Daily Relative Strength Index (RSI) trades at 53 with a neutral stance indicating the extension of sideways movement.
MACD: The Moving Average Convergence Divergence (MACD) holds above the midline also with a neutral outlook.


