Bitcoin (BTC) has seemingly reversed its trend after bouncing at the middle of its previous trading pattern. It’s possible that the short-term correction is now complete.
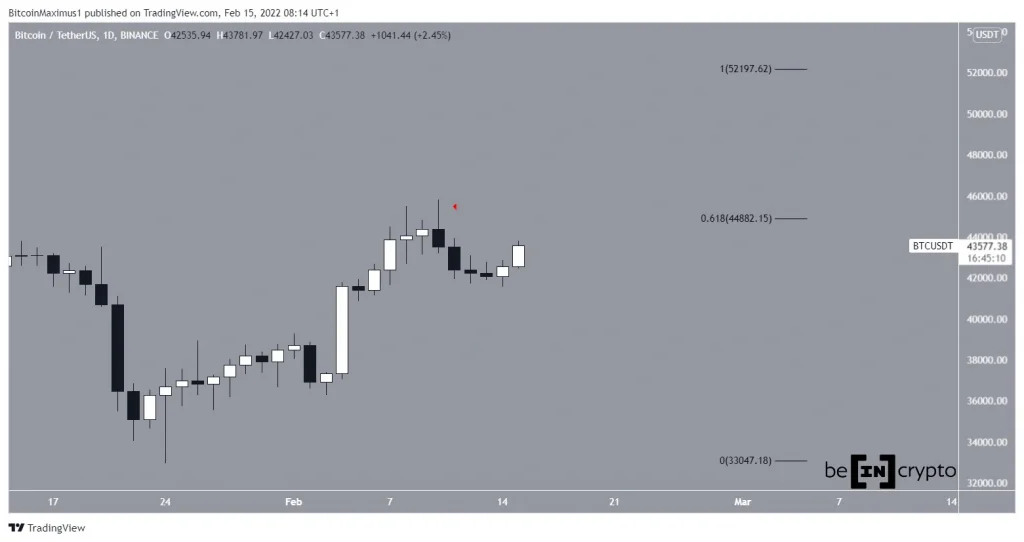
Bitcoin (BTC) had been falling since Feb 10 after reaching a local high of $44,821, creating a shooting star candlestick (red icon). The rejection occurred at the 0.618 Fib retracement resistance level at $44,890 and led to a low of $41,550 on Feb 14.
The price has rebounded since and is currently trading at $43,781. BTC is now approaching the $44,890 resistance area once again.
BTC bounces at channel
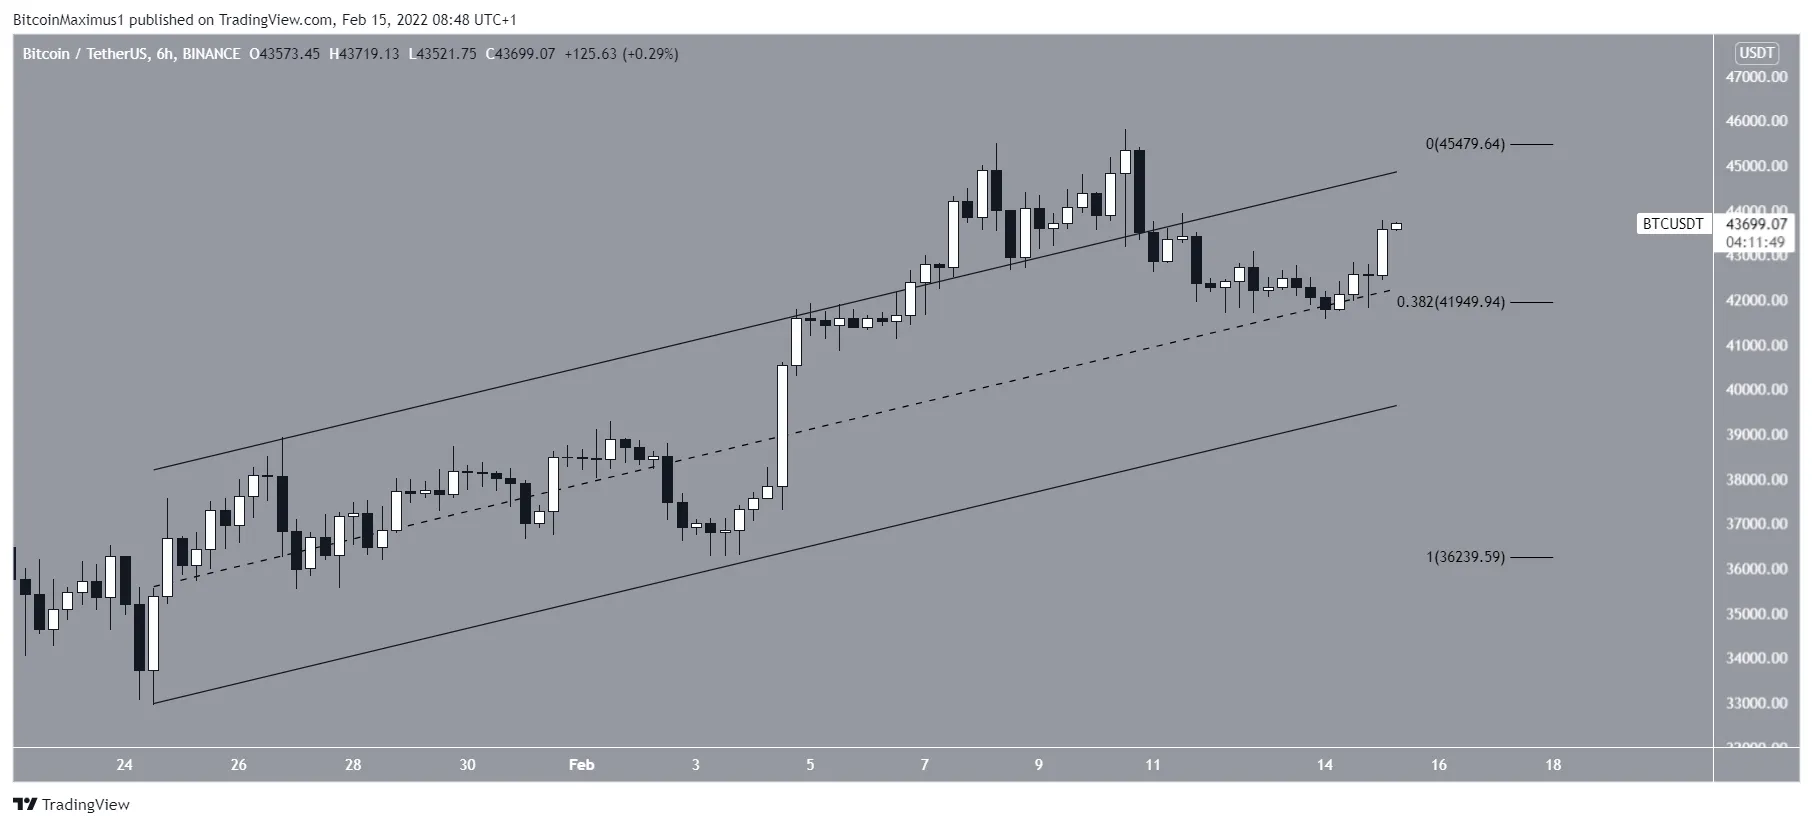
The six-hour chart shows that BTC has bounced at the midline of an ascending parallel channel, which had previously been in place since Jan 24.
After breaking out on Feb 6, BTC returned to the middle of the channel and validated it as support. This bounce also coincides with the 0.382 Fib retracement support level at $41,950.
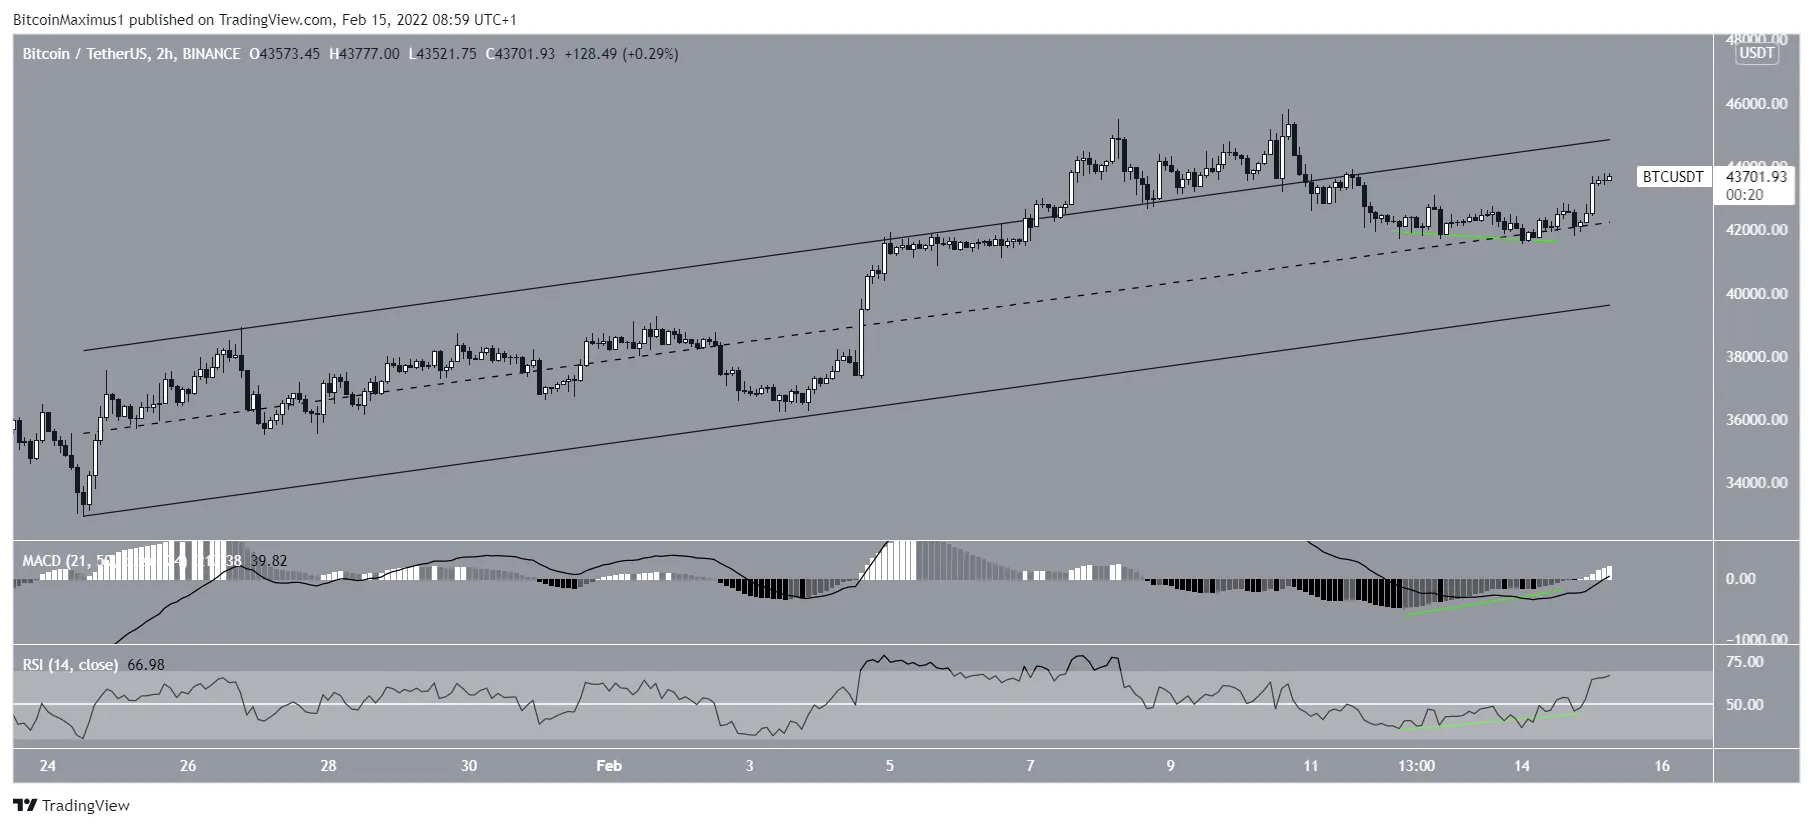
An even closer look at the two-hour time frame shows that the ongoing upward movement was preceded by significant bullish divergences in both the RSI and MACD. Such divergences often precede trend reversals.
Therefore, the current pattern supports the possibility of the upward move continuing.
Wave count
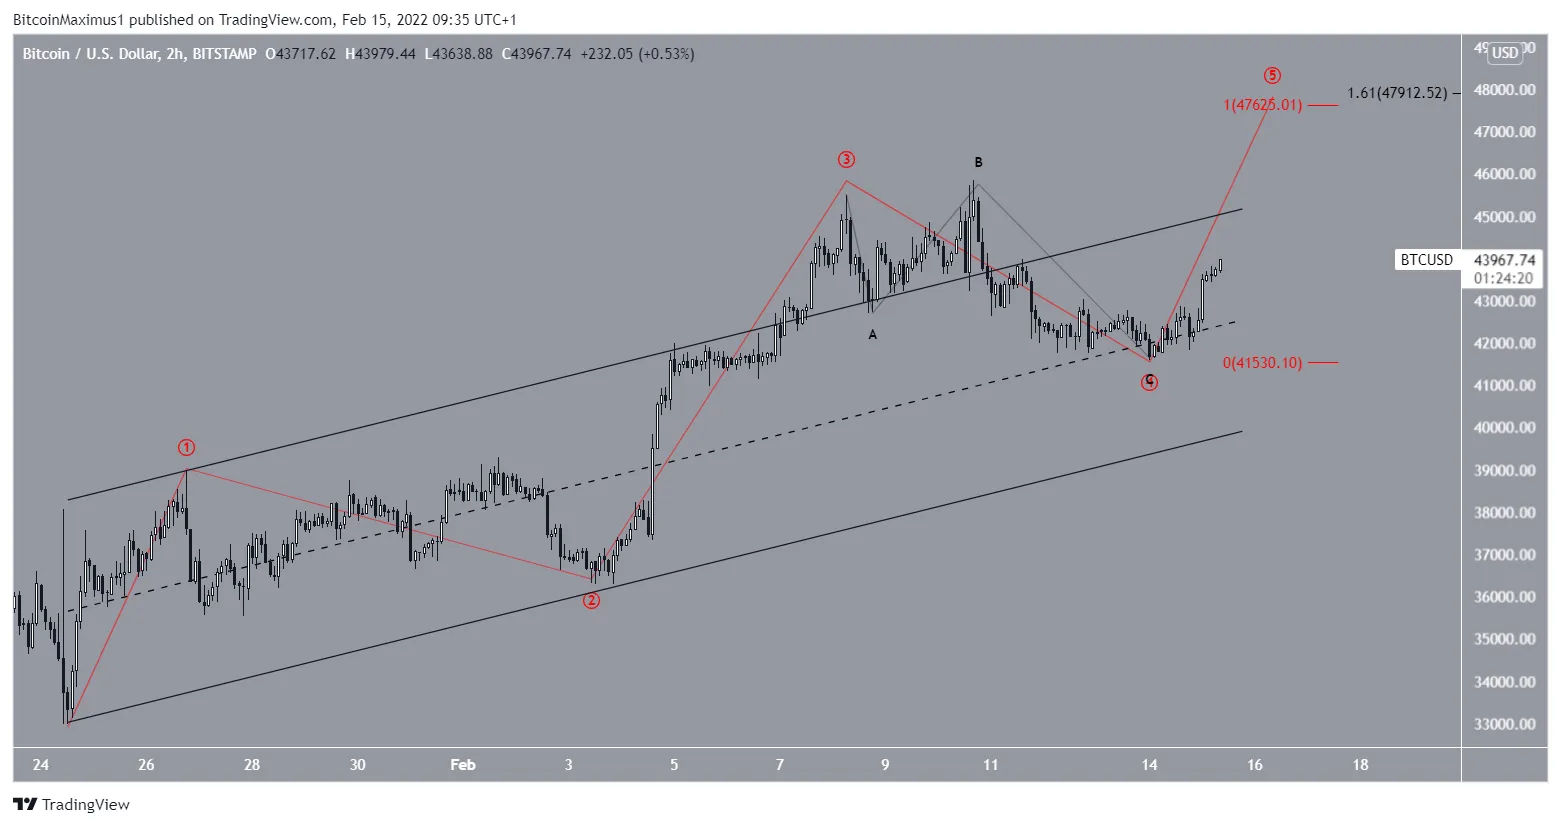
The wave count suggests that BTC has completed wave four of a five-wave upward move and has just begun the fifth and final wave of this increase.
The most likely target for the top is found between $47,625 and $47,912. This target range is the length of wave one (red) and an external retracement on wave four (black).
BeInCrypto’s previous Bitcoin (BTC) analysis, click here
Disclaimer
All the information contained on our website is published in good faith and for general information purposes only. Any action the reader takes upon the information found on our website is strictly at their own risk.


