On-chain data shows the Bitcoin NVT ratio currently has values that would suggest the crypto is undervalued at the moment.
Bitcoin NVT Ratio Is Moving On A Downtrend Right Now
As pointed by an analyst in a CryptoQuant post, the BTC NVT ratio currently has low values that would mean the coin is undervalued right now.
The “Network Value to Transactions” (or NVT in short) is an indicator that’s defined as the ratio between the Bitcoin market cap and the transacted volume during a specific time period.
Basically, the metric evaluates the value of the crypto using its transaction volume. When the NVT value is high, it means BTC is currently overvalued compared to the ability to transact coins. Such a trend can be bearish for the crypto
On the other hand, when the value of the the indicator is low, it implies Bitcoin may currently be undervalued at the moment. This kind of trend can be bullish for the price of the crypto.
Related Reading | Bitcoin Market Dominance Hit Highest Since November 2021, No Alt Season in Sight
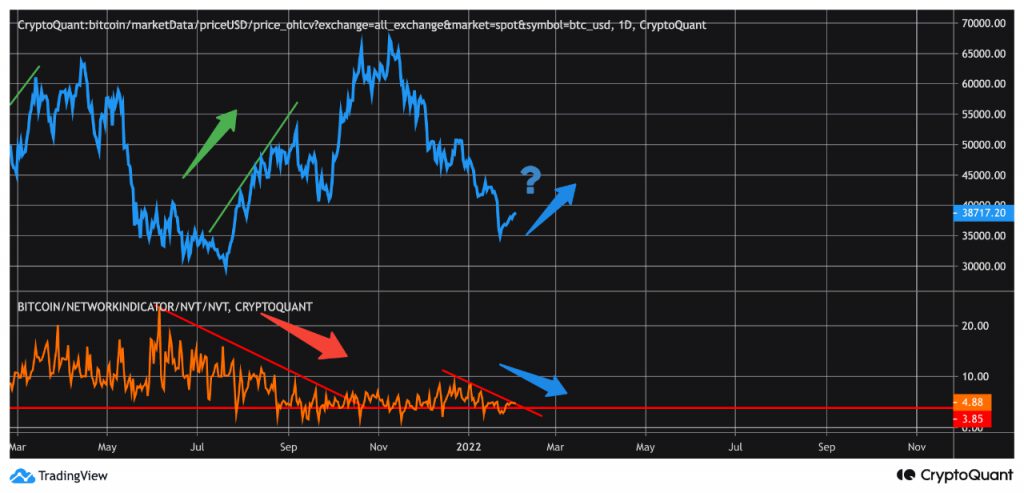
Now, here is a chart that shows how the value of the BTC NVT ratio has changed over the past year:
The value of the metric seems to be on a downtrend right now | Source: CryptoQuant
As you can see in the above graph, the Bitcoin NVT ratio has been on a downtrend for a while now, and the metric currently has a low value.
Related Reading | Bloody Altcoin January Shows Why Bitcoin Remains The Crypto Safe Haven
Historically, such a downtrend in the indicator has usually been followed by an uplift in the price of the cryptocurrency.
The current value means that Bitcoin is undervalued at the moment, and if past pattern related to the downwards trajectory holds, then the outcome may be bullish for the price of the crypto in the near term.
BTC Price
At the time of writing, Bitcoin’s price floats around $38.6k, up 2% in the last seven days. Over the past month, the crypto has lost 18% in value.
The below chart shows the trend in the price of BTC over the last five days.

BTC's price seems to be holding strong around the $38k price mark | Source: BTCUSD on TradingView
Since the crash to $33k, Bitcoin has shown some recovery, and has held above the $38k level in the last few days. Currently, it’s unclear if the bottom is in, or if the the value of the crypto will further drop still.
However, if the NVT ratio is anything to go by, BTC may be undervalued right now, and thus its outcome may be bullish in the near future.
Featured image from Unsplash.com, charts from TradingView.com, CryptoQuant.com


