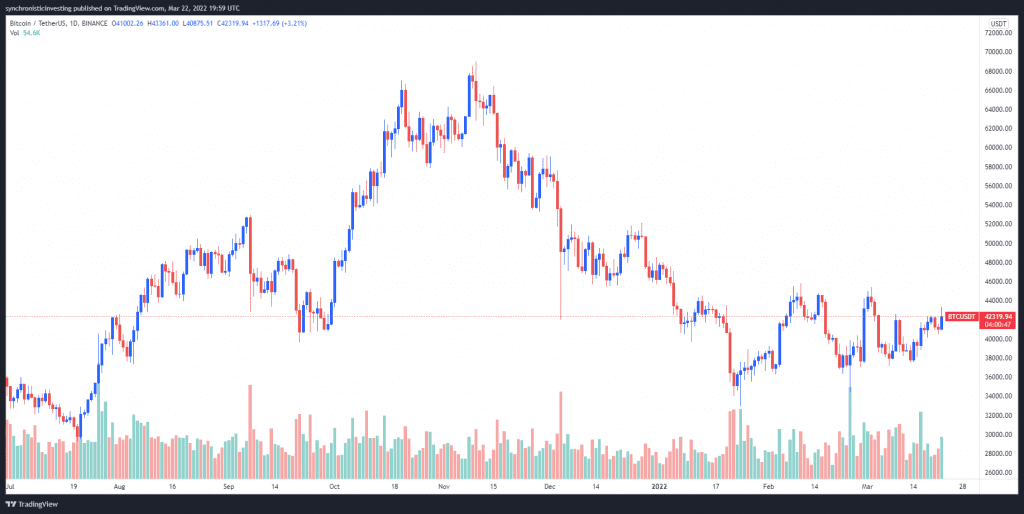
The bullish narrative is beginning to build across the cryptocurrency ecosystem on March 22 as the price of Bitcoin (BTC) briefly spiked above $43,000 while Ether (ETH) has reclaimed support at $3,000 following a deposit of $110 million worth of ETH into Lido’s liquidity pools.
Data from Cointelegraph Markets Pro and TradingView shows that the price of Bitcoin rallied 6.15% from a low of $40,884 in the early hours of Tuesday to an intraday high at $43,380 before consolidating around support at $42,300.
Here’s what several analysts are saying about Bitcoin’s recent price action and which support and resistance levels to keep an eye on moving forward.
BTC price could correct lower
A foreshadowing of Bitcoin’s move on March 22 was provided by market analyst and pseudonymous Twitter user “Rekt Captial,” who posted the following chart noting that “If Bitcoin successfully retests the green dashed diagonal as new support,” then it “will spring towards the green ~$43100 resistance ahead.”

According to the trader, this was a notable development because it “confirmed” the end of the “multi-month series of lower highs” for Bitcoin and suggests we could soon head higher.
Despite this bullish turn of events, fellow trader and pseudonymous Twitter user “Ed_NL” warned that it may still be a bit premature to open a BTC long based on price action following the pump.

“BTC forming a bearish flag after the initial drop, but this feels like a typical trap where we first take out the early shorters before going down to correct,” the analyst opined.
Potential squeeze higher
The upward trend for BTC was also highlighted by crypto trader and host of The Wolf of All Streets podcast Scott Melker, who posted the following chart noting that Bitcoin is “still making higher lows, consolidating towards the key level around $45,500.”

Options trader and pseudonymous Twitter user “Joh Wick” also noted this upward drift on the BTC chart, suggesting that there is a potential squeeze in play that could lead to further price gains.

Wick further explained:
“Remember we have squeeze shading zone that looks like it wants to breakout! Could be the technical catalyst to get us past $45,000 – $46,000 resistance.”
Related: Bitcoin hovers at $43K on Wall Street open amid growing fever over Terra’s $3B BTC buy-in
Needs to hold support at $42,300
A final bit of insight was provided by crypto trader and Cointelegraph contributor Michaël van de Poppe, who posted the following chart highlighting the run-up in Bitcoin, which has managed to hold on to a “crucial support.”

“If Bitcoin can sustain those levels, it seems to me that we’re getting a period of some relief rallies across markets. Would be good,” van de Poppe explained.
The overall cryptocurrency market cap now stands at $1.923 trillion and Bitcoin’s dominance rate is 42%.
The views and opinions expressed here are solely those of the author and do not necessarily reflect the views of Cointelegraph.com. Every investment and trading move involves risk, you should conduct your own research when making a decision.


