Disclaimer: The findings of the following analysis are the sole opinions of the writer and should not be considered investment advice
Since the beginning of this year, Bitcoin Cash (BCH) has sharply declined while piercing through some critical price points. For the most part, the 50 EMA (cyan) has stood firmly as a sturdy resistance.
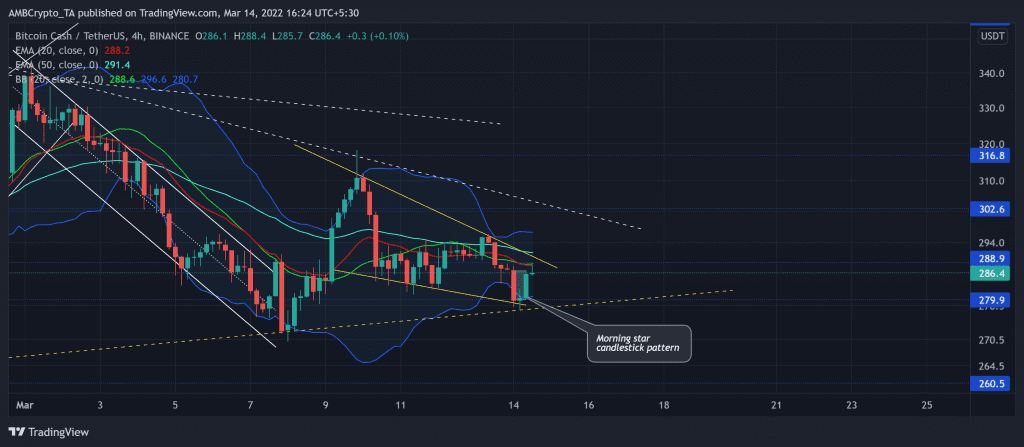
A compelling close above the $288-mark could position BCH for a test of its trendline resistance (white, dashed), one that also coincides with the $302-resistance. Even so, the bulls still need more thrust to overturn the 20/50 EMA barrier.
At press time, Bitcoin Cash was trading at $286.4.
BCH 4-hour Chart
The altcoin lost over 64% of its value over the last 12 weeks and hit its 13-month low on 24 January. The bulls finally stalled the downturn by stepping in at the $260-mark 15-month support. Consequently, the bulls gained enough thrust to jump above the near-term EMAs but struggled to overturn its trendline resistance.
The long-term bearish tendencies visibly prevailed as the price hovered below the mean (green) of Bollinger Bands (BB). After a recent bearish move, BCH retested the $279-support, one that coincided with the lower band of the BB. Also, it formed a morning star bullish candlestick pattern on its 4-hour chart. As a result, it revived until the mean of its BB.
Now, any close above its mean could further increase the chances of a patterned breakout. In such a case, the $302-level would offer strong resistance. Should the buyers lose their edge, BCH can aim for a retest of its immediate support before picking itself up to challenge its pattern.
Rationale
The RSI did see decent recovery over the last day, but it halted at the 46-mark. A close above this level is crucial for the buyers to propel a jump above the 50 EMA.
Further, the CMF maintained its peak over the last day and revealed increasing money flows. A close above the zero-line would affirm the superior buying influence. To top it up, the AO flashed some improvement with a green bar on its histogram.
Conclusion
Following the recent increase in buying influence, a break above its EMAs would set the alt up for a test of the $302-level. This, before it reverses into its long-term downtrend.
Having said that, BCH shares an 87% 30-day correlation with the king coin. Thus, keeping a watch on Bitcoin’s movement would be vital in making an accurate decision.


