Disclaimer: The findings of the following analysis are the sole opinions of the writer and should not be considered investment advice.
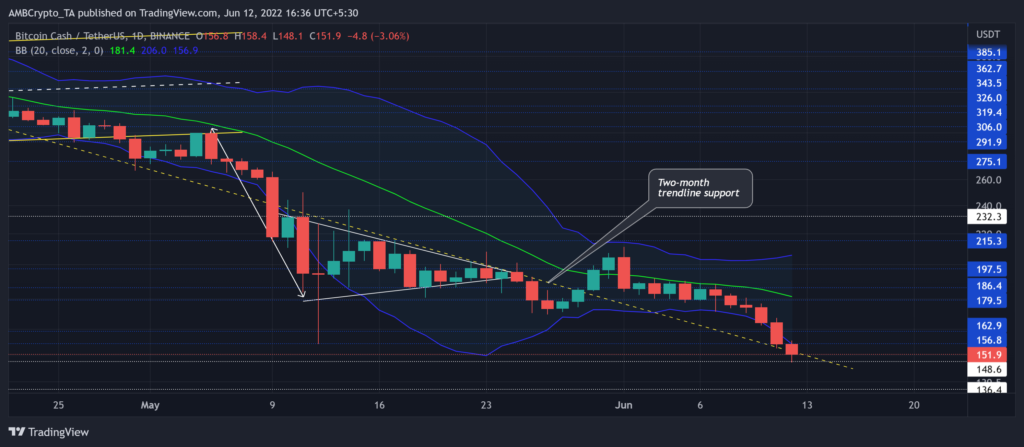
Bitcoin Cash [BCH] has been subjected to heavy sell-offs in the last six weeks post an up-channel (yellow) breakdown on 30 April. The price has been hovering near the lower band of the Bollinger Bands (BB) for the most part ever since.
A convincing close below the two-month trendline support (yellow, dashed) would open doorways for an extended retracement. Any close below the $148-zone would delay the bullish revival chances in the near term. At press time, BCH was trading at $151.9, down by 7.75%in the last 24 hours.
BCH Daily Chart
Given the aggregated fear sentiment, it has been relatively simple for BCH sellers to find fresher grounds to rest on. A reversal from the $362-zone in April chalked out a two-month trendline support on the daily timeframe.
Since then, the coin has been on a steady fall. The broader liquidations pulled BCH down to its 27-month low at the time of writing.
With BB’s lower and upper bands looking opposite ways, the bears would now strive to push for a high volatility phase in the coming days. As the trading volumes were in a decline phase, the trend was yet to take a compelling shape.
Any close below the 148-support would pull BCH for a further downside toward the $136-level. Post this, the bulls would likely aim to counter the selling pressure for its multi-yearly lows. A near-term bullish revival would likely be short-lived by the south-looking basis line of BB.
Rationale
Over the last three days, the bearish RSI snapped the 38-resistance to dip into the oversold region. A potential bounce-back could delay any further corrections on the chart.
With the MACD lines undertaking a bearish crossover after nearly three weeks, the selling pressure saw a resurgence. The buyers still needed to bridge the gap between MACD lines and the zero-mark to claim an edge.
Conclusion
The altcoin exhibited a one-sided bearish structure. A robust breach below the two-month trendline support would blend well with the bearish narrative. A close below the $148-mark would reaffirm a shorting signal.
But with oversold readings on the RSI, buyers could the onslaught by countering the near-term selling pressure.
Moreover, BCH shares a 47% 30-day correlation with the king coin. Thus, keeping a watch on Bitcoin’s movement would be vital in making an accurate decision.


