Disclaimer: The findings of the following analysis are the sole opinions of the writer and should not be considered investment advice.
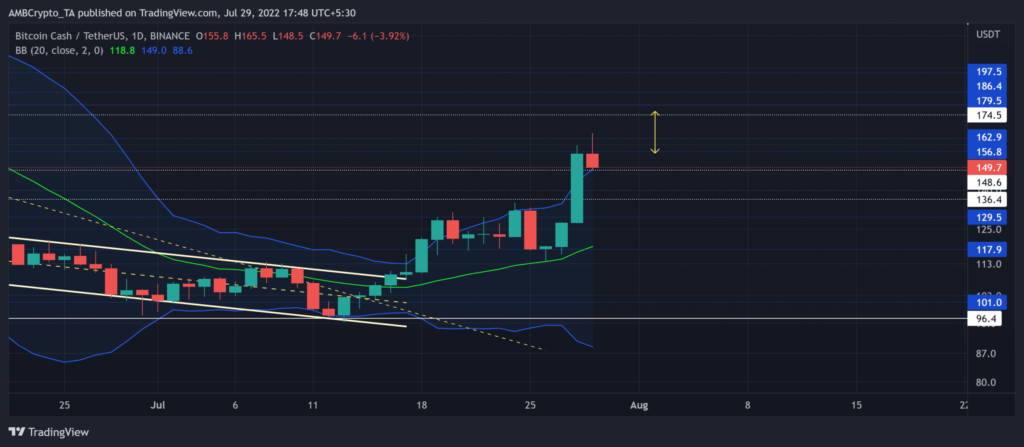
Since dropping from the $275 baseline in early May, Bitcoin Cash [BCH] finally found rebounding opportunities after plunging to its record low in the $96-zone.
The price has been hovering near the upper band of the Bollinger Bands (BB) for the last two weeks as it broke into high volatility.
A compelling close above the $162-$174 range could ensure a continued bull run in the coming days.
Any close below the immediate support could aid the selling efforts to invalidate near-term bullish tendencies. At press time, BCH was trading at $149.7, up by 4.83% in the last 24 hours.
BCH Daily Chart
The bears capitalized on the aggravated fear sentiment by pulling BCH towards its fresher multi-yearly lows on 13 July. But the bulls finally flipped the three-month trendline resistance to support in the recent rally.
The altcoin registered a 74.4% devaluation (from 5 April) and matched its December 2018 lows a few weeks ago.
With the basis line of BB (green) looking north, the buyers would aim to continue their buying spree. Also, the trading volumes marked a double-digit 24-hour uptick that propelled a bullish engulfing candlestick on the chart.
Any close above the $174 resistance could put BCH into price discovery. In this case, potential targets could lie in the $196 region. However, a near-term bearish pull can delay this recovery by causing a retest toward the $130-$136 range in the coming sessions.
Rationale
Over the last day, the bearish RSI slammed into the overbought-mark resistance. A sustained reversal below this level would aid the sellers in preventing an immediate breakout.
Furthermore, the CMF maintained its peaks over the past week and saw a mild bearish divergence with the price action. Nonetheless, the MACD lines have found a spot above the zero-mark to depict an increasing buying momentum.
Conclusion
Given the mixed readings on the indicators, BCH could see a short-term slowdown. Eventually, the bulls would aim to snap the $174-mark. The targets would remain the same as above.
However, BCH shares a staggering 89% 30-day correlation with the king coin. Thus, keeping a watch on Bitcoin’s movement would be vital in making an accurate decision.


