The overall cryptocurrency market cap shed more than 6% and stood at $1.4T in value as per CoinMarketCap. Bitcoin, Ethereum, and other alternative coins suffered the same fate as the bloodshed continued to intensify. Bitcoin, the largest crypto, fell by more than 6% as it traded around the $31k mark, at press time.
Now, to curb losses, holders aimed to de-risk their portfolios.
Maximal crowd polarization
Source: Santiment
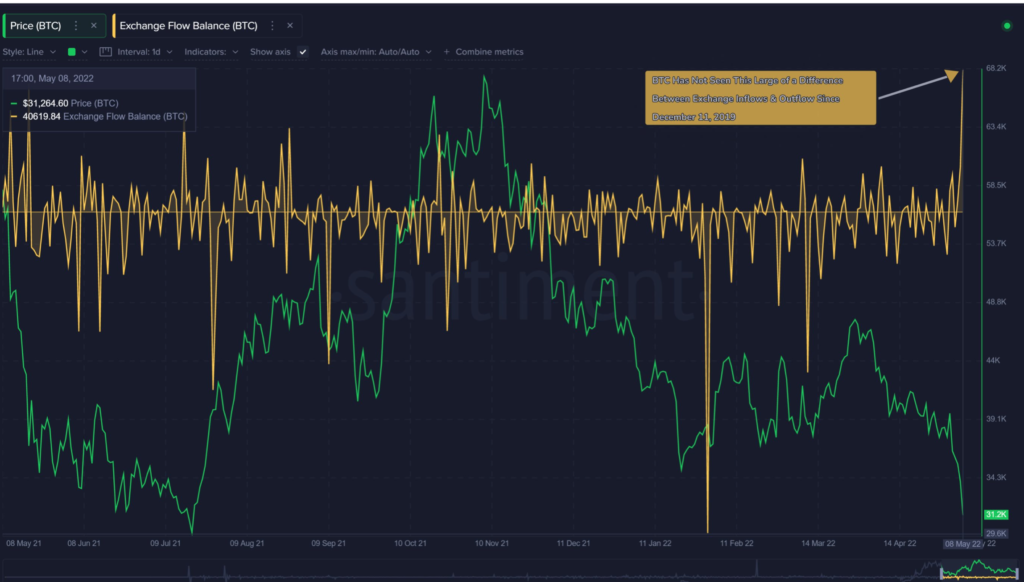
The Bitcoin network saw a net 40.6K BTC moving into exchanges. This means investors sent BTC into exchanges to either de-risk their portfolio or to protect margin positions with more collateral.
This exodus is visible in the graph above. And, it is the largest spike since December 2019. As per the analytical firm, Santiment, this marked “maximal crowd polarization.”
Data from Cryptoquant added that the spot exchange inflows hit a new two-year peak as BTC whales deposited their holdings in exchanges.
$BTC whales are depositing their holdings in exchanges
1. All Exchanges Inflow hits a 1-year high
2. Spot Exchanges Inflow hits over a 2-year highLive Chart👇 https://t.co/0ti93G7oyj pic.twitter.com/wkdTEpMoEc
— CryptoQuant.com (@cryptoquant_com) May 10, 2022
All the data above shows that investors are in full panic mode and the crypto market is completely bearish. This is further confirmed by the Bitcoin fear and greed index, which dropped to 10 from 11.
What else can we call this?
Different platforms within the crypto industry released their set of views concerning the ongoing bearish situation. Glassnode, a blockchain analysis firm, showcased some deep insights in the latest newsletter published on 9 May.
The #Bitcoin market saw and extremely volatile week, with prices trading down to $33.8k, and an additional 10% of the network falling into loss.
We analyse the market reaction across the mempool, exchanges, derivatives and stablecoin supply contractions.https://t.co/WDuzlObVxK
— glassnode (@glassnode) May 9, 2022
Interestingly, the average fee paid per transaction rose to $2.72 last week, about 15% higher than the typical average, according to BitInfoCharts, an on-chain data tracker. The total value of all on-chain transaction fees paid reached 3.07 BTC.
Considering the aforementioned graph, Glassnode’s analysis stated,
“This is higher than was seen during the 4-December deleveraging event, at which time the market dropped -34.5% in one day (covered in Week 49, 2021), and is again the largest value in our data-set to date.”
Here’s the surprising part. Investors, most likely, paid higher-than-average fees to prioritize their bids to de-risk their portfolio or add collateral to their margin positions.
In addition, the dominance of on-chain transaction fees associated with exchange deposits also signaled urgency, reaching the second-highest value in history.
This further supports the case that Bitcoin investors were seeking to de-risk, sell and/or add collateral to margin in response to market volatility.
Any takers?
Needless to say, the BTC holders count took a massive hit following such a bearish market sentiment. Even dominant BTC holders started selling their coins. Glassnode noted that BTC accumulation maintained a low trend since the middle of April.
“Shrimps,” who hold less than an entire Bitcoin, remained the largest accumulators of any cohort of wallets up to whales through the past week.
Overall, given the current scenario, this transition shouldn’t come as a total surprise.


