On-chain data suggests Bitcoin OTC transactions have been active recently, while exchange transfers have gone down.
Bitcoin Fund Flow Ratio Declines, While Tokens Transferred Go Up
As pointed out by an analyst in a CryptoQuant post, there are signs that over-the-counter (OTC) deals might be going up in the BTC market.
The first indicator of relevance here is the “fund flow ratio,” which is defined as the total amount of Bitcoin flowing into or out of exchanges, divided by the total BTC being transacted on the whole network.
When the value of this metric is low, it means a lesser part of the total network transactions are taking place on exchanges right now.
On the other hand, the ratio’s value being high implies investors are actively using exchanges at the moment.
Another indicator is the “tokens transferred,” which is simply the total number of Bitcoin tokens that were involved in transactions on the chain on any given day.
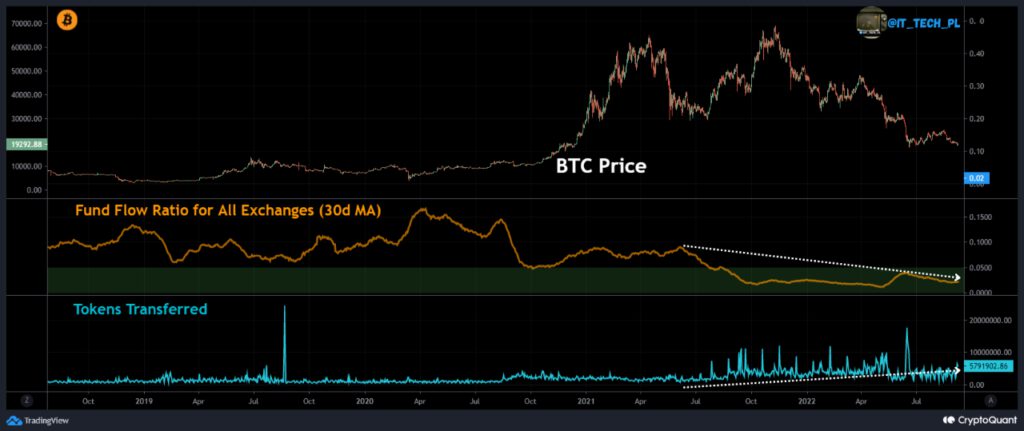
Now, here is a chart that shows the trend in these two BTC metrics over the last few years:
Looks like the number of coins being moved on the chain has been going up | Source: CryptoQuant
As you can see in the above graph, the Bitcoin fund flow ratio (30-day moving average) has been on a downtrend since a while now.
This means that investors haven’t been as actively moving coins in and out of centralized exchanges in recent times.
But at the same time, the total number of tokens transferred has been observing an uplift. This would suggest that instead of exchange volumes just going down, the decline in the fund flow ratio is also because of the total coin transfers on the chain increasing.
This can imply that a large part of the total network transactions are coming from OTC deals taking place off exchanges.
Therefore, activity on exchanges might now might be becoming less relevant to the price of the crypto compared to the transfers happening outside them.
BTC Price
At the time of writing, Bitcoin’s price floats around $21.1k, up 4% in the last seven days. Over the past month, the crypto has lost 11% in value.
The below chart shows the trend in the price of the coin over the last five days.

The value of the crypto seems to have surged up over the last day | Source: BTCUSD on TradingView
After plunging down a few days ago, Bitcoin has showed some sharp recovery during the past 24 hours as the crypto has broken above $21k.
Featured image from Jeremy Bezanger on Unsplash.com, charts from TradingView.com, CryptoQuant.com


