The Bitcoin dominance rate (BTCD) has failed to sustain its upward movement and could head towards its January 2018 lows
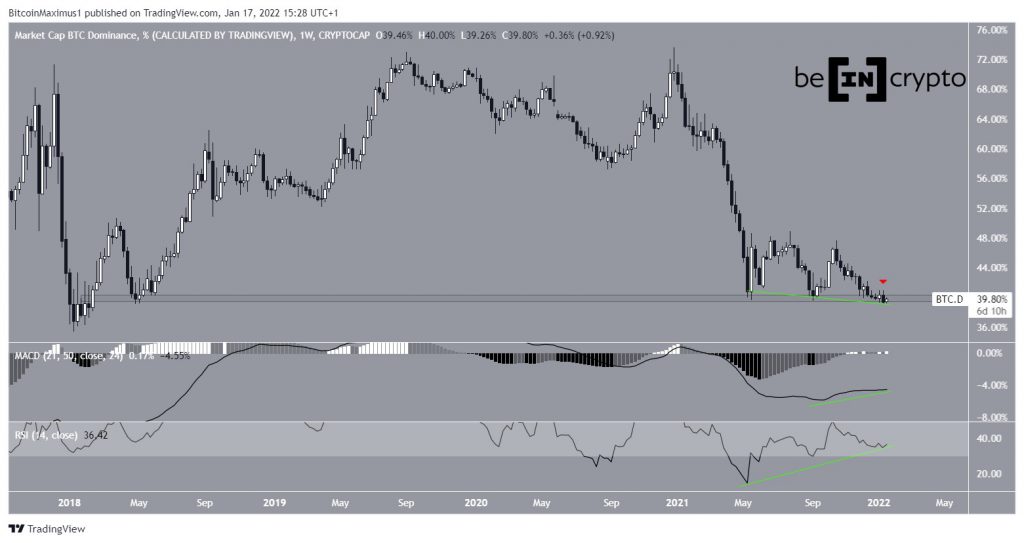
BTCD has been sharply decreasing since Jan 2021, when it had just reached a high of 73.63%. Since the beginning of May, it has been hovering just above the 40% horizontal support area, which has been in place since 2018.
While the are has been the catalyst for two bounces, the second was weaker than the first, which is a sign of weakness.
In another bearish development, last week’s close (red icon) was the lowest since 2018.
Technical indicators are providing mixed signs. While there is a considerable bullish divergence developing in both the RSI and MACD (green line), both indicators are still in negative territory.
Therefore, the weekly time-frame does not provide a consensus for the direction of the trend, but is leaning on bearish.
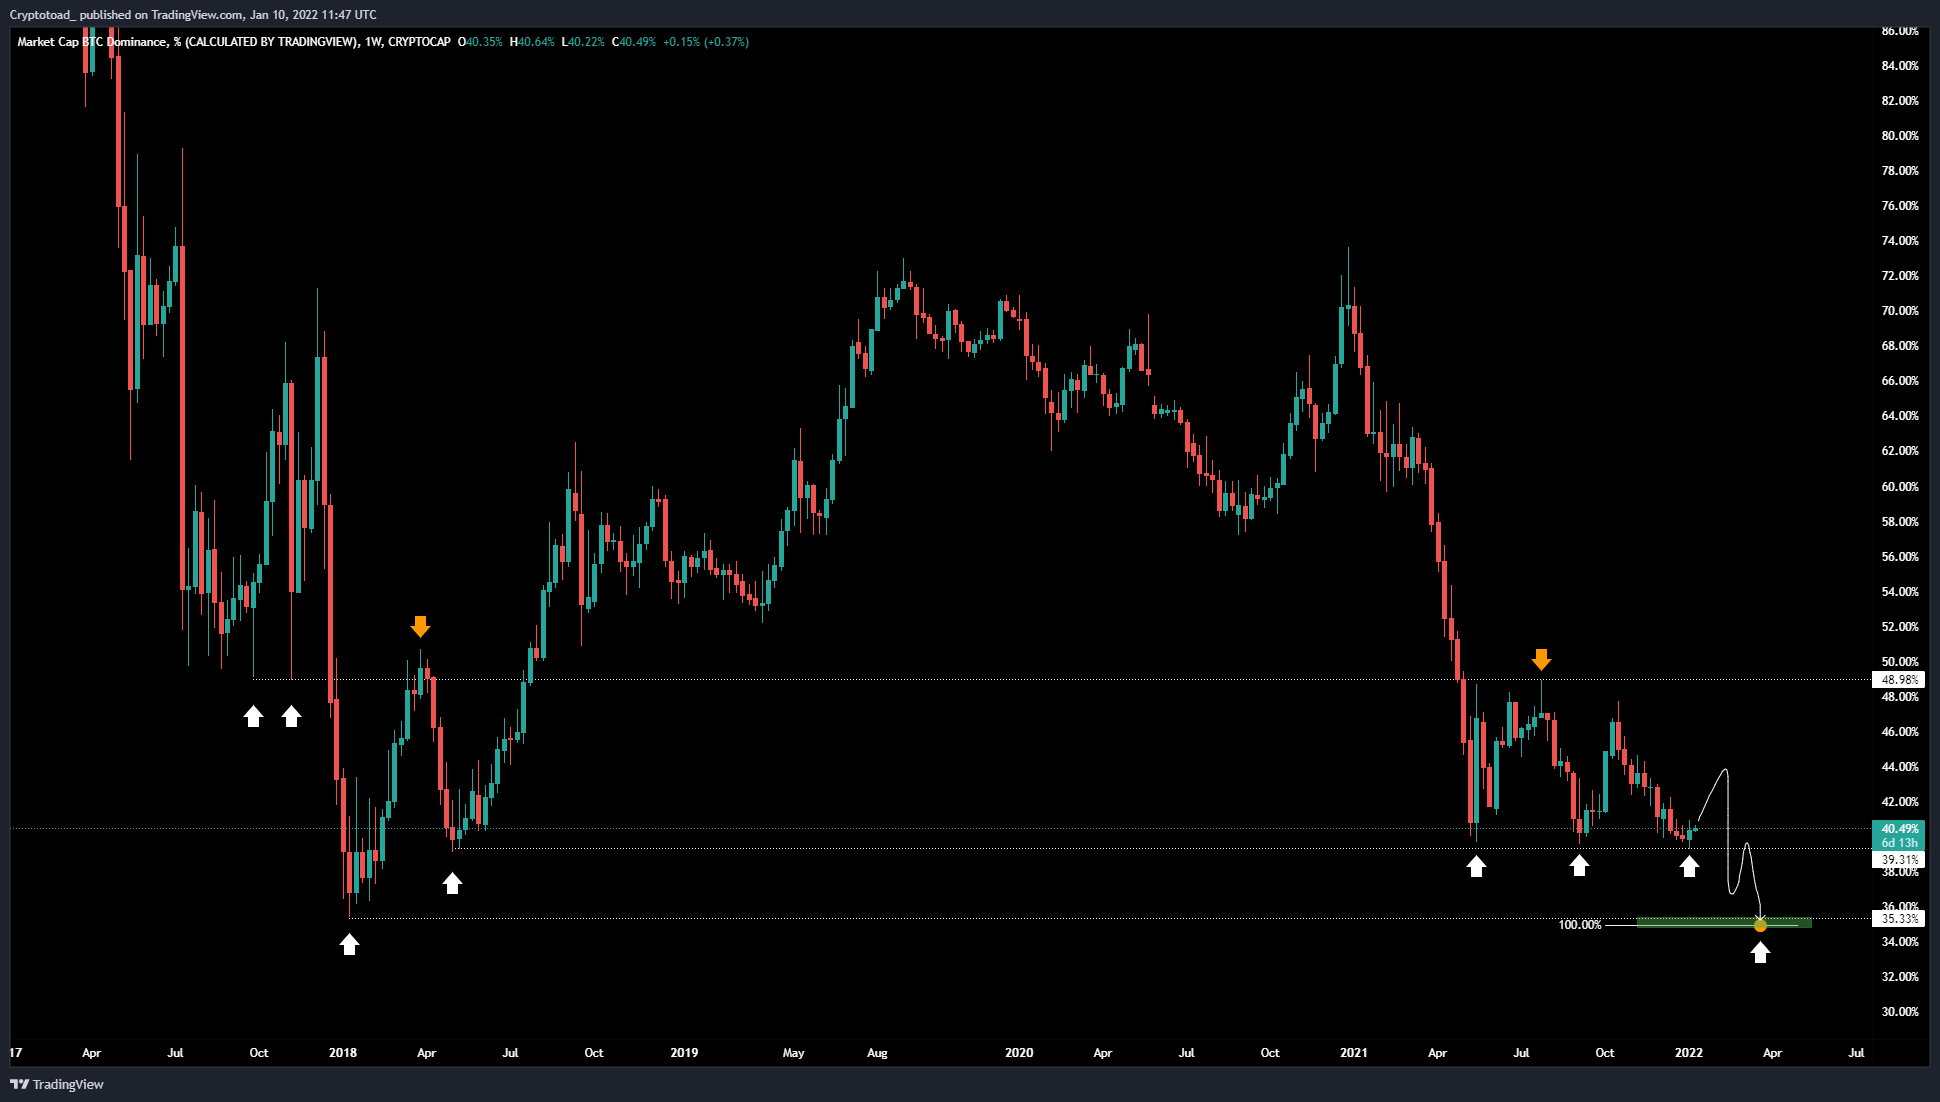
Cryptocurrency trader @Mesawine1 tweeted a BTCD chart, stating that the token is likely to increase towards a new all-time low.
Due to the ambiguity from the weekly time-frame, a look at the daily one is required in order to determine the direction of the trend.

Future BTCD movement
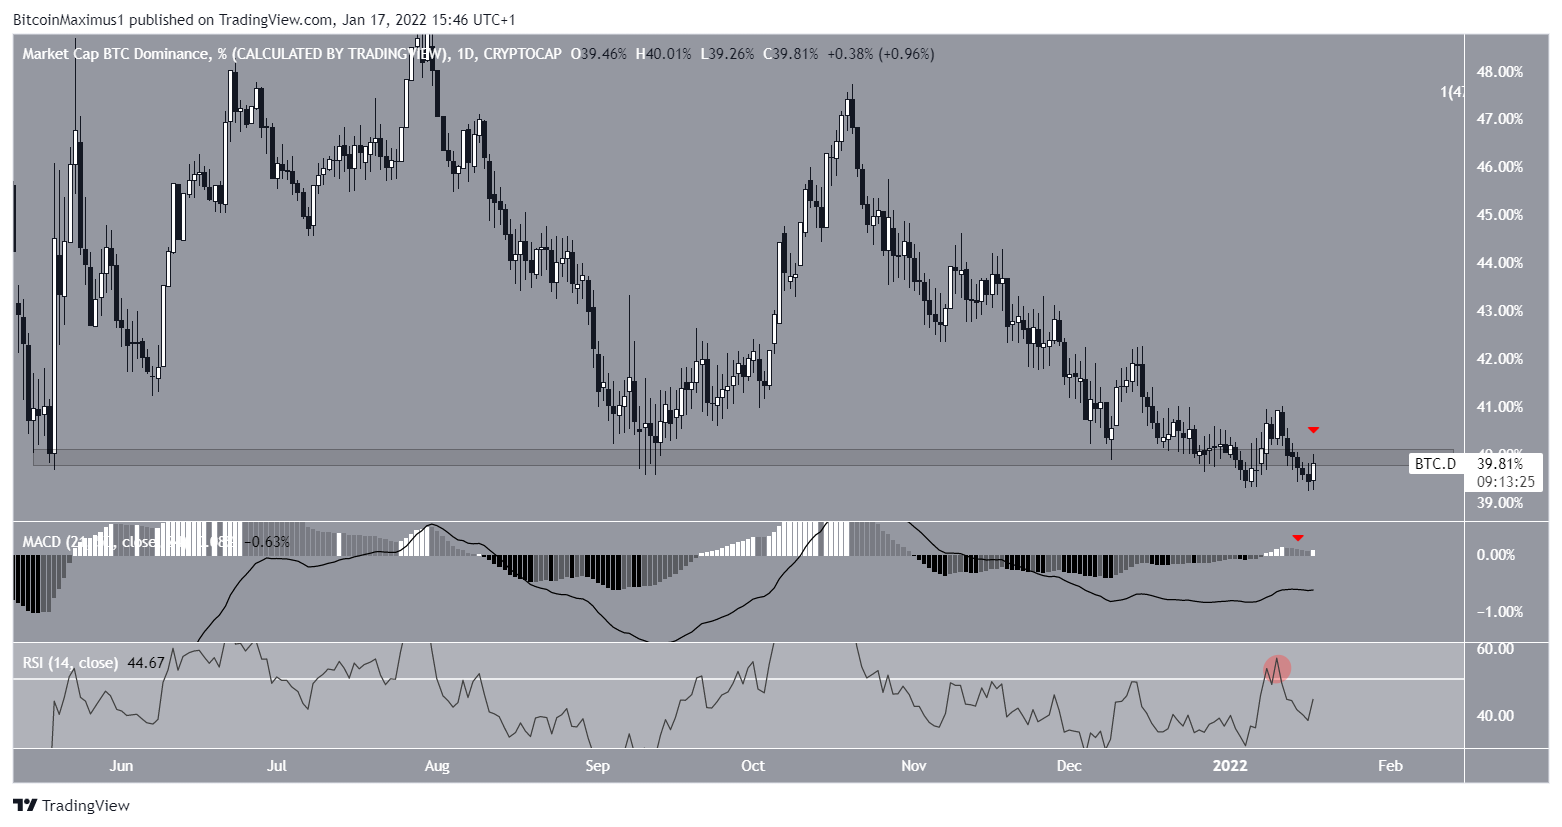
The daily time-frame suggests that it is more likely for BTCD to continue decreasing than it is for it to bounce.
The first reason for this is that it seems that BTCD has already broken down from the 40% area. It now seems to be in the process of validating it as resistance (red icon). This is a bearish development that often leads to the continuation of the downward movement.
Secondly, the MACD has created three consecutive lower momentum bars and has nearly crossed into negative territory. Furthermore, the RSI has fallen below the 50 line after deviating above it (red circle). These are all signs that a downward movement would be the most likely scenario.

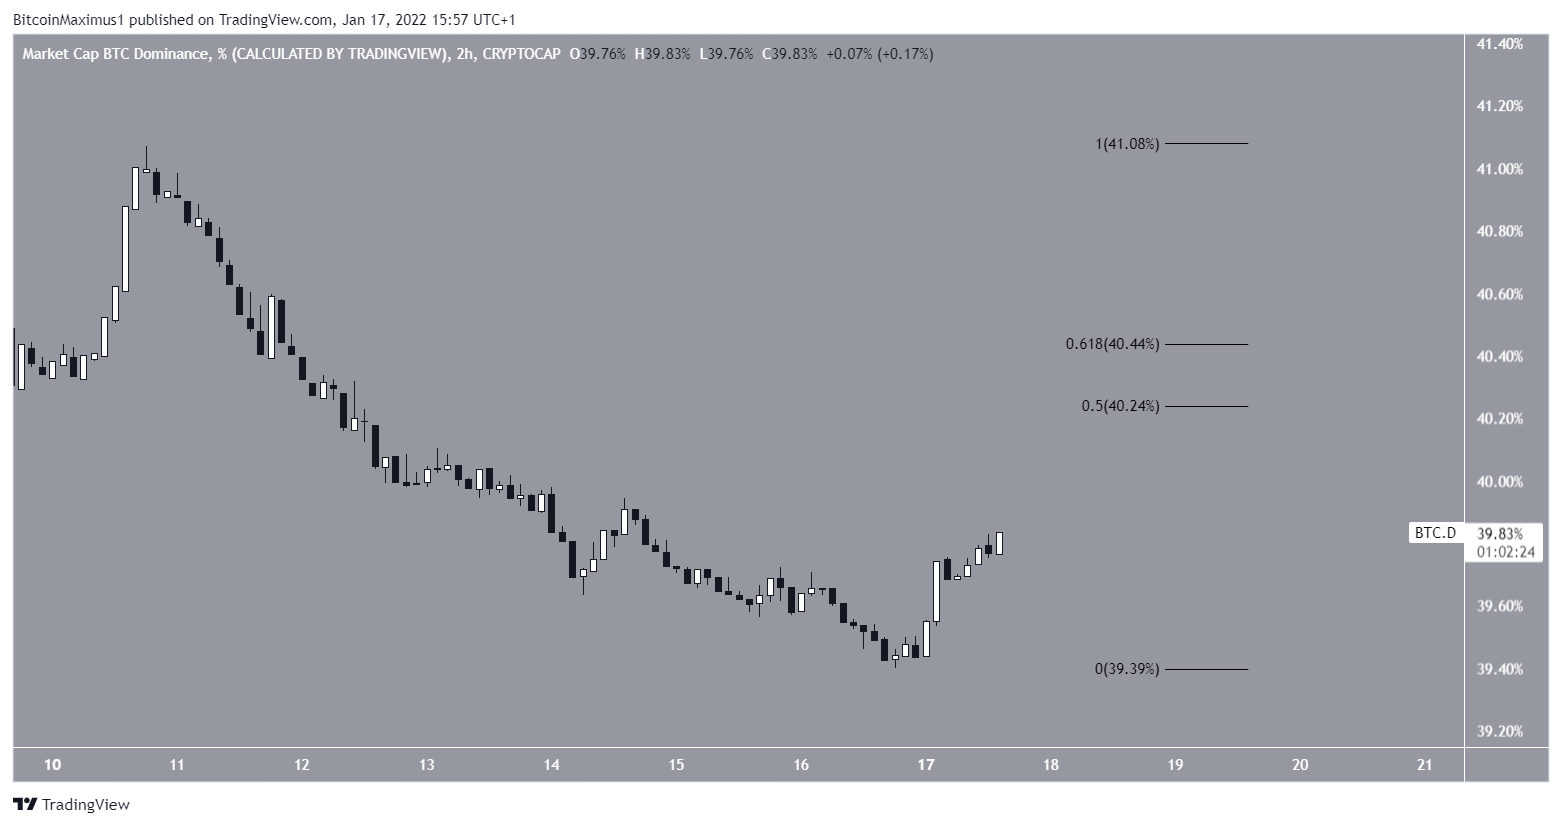
Since BTCD is increasing in the short-term, the most likely scenario would have it moving upwards towards the 0.5-0.618 Fib retracement resistance levels at 40.2-40.4% before another drop towards the all-time low region at 35.5%

For BeInCrypto’s latest Bitcoin (BTC) analysis, click here.
Disclaimer
All the information contained on our website is published in good faith and for general information purposes only. Any action the reader takes upon the information found on our website is strictly at their own risk.


