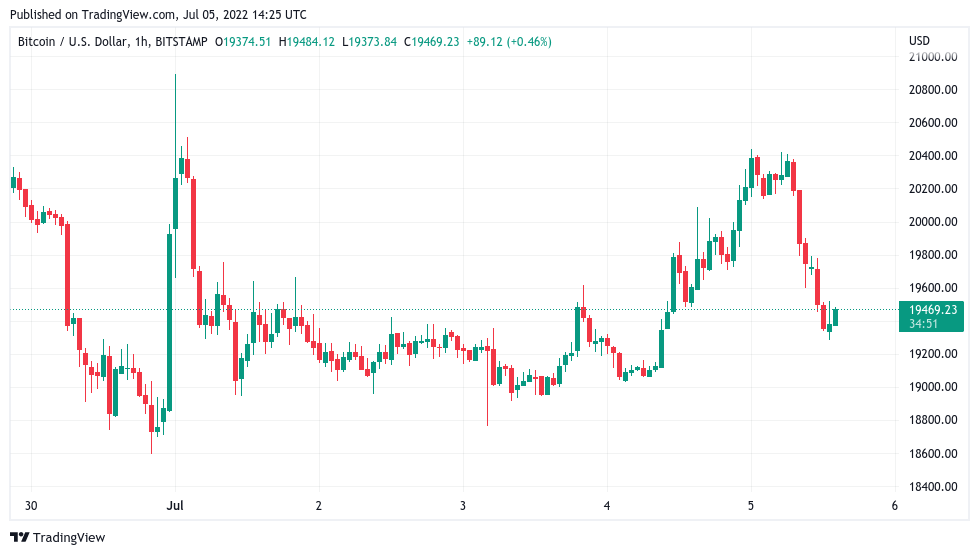
Bitcoin (BTC) hit daily lows on the July 5 Wall Street open as the U.S. dollar saw a violent surge higher.
USD sets yet another 20-year record
Data from Cointelegraph Markets Pro and TradingView showed BTC/USD retreating to $19,281 on Bitstamp as the Independence Day long weekend concluded with a bump.
The pair had seen last-minute gains the day prior, these fizzling as the return of Wall Street trading was accompanied by USD strength laying waste to gains across risk assets and safe havens.
Bitcoin traded down $1,000 on the day, while spot gold shed over 2% and U.S. equities markets also fell. The S&P 500 was down 2.2% at the time of writing, while the Nasdaq Composite Index lost 1.7%.

The U.S. dollar index (DXY), on the contrary, hit 106.59, a level not seen since December 2002 and above previous breakouts from Q2 this year.
Bitcoin analysts thus waited for signs of a trend reversal to provide some relief to crypto markets.
Waiting for Dollar Crash $DXY pic.twitter.com/HaKXIM3OFB
— Trader_J (@Trader_Jibon) July 5, 2022
“Euro hitting record levels, $1.033 at this point. Last seen in the years 2002–2003 and DXY, of course, shooting up like a rocket,” Cointelegraph contributor Michaël van de Poppe commented, noting that the euro was heading towards USD parity.
In additional commentary, Caleb Franzen, senior market analyst at Cubic Analytics, pointed to how the DXY shed light on investor sentiment over the health of the economy.
“Over the past week, yields are falling but the dollar keeps rising. This dynamic proves that investors are rushing to safety, with heightened fears of recession,” part of a tweet read.

Crypto Fear & Greed Index hits 2-month high
While volatility edged back into crypto markets, sentiment was yet to reflect the impact of a rampant dollar.
Related: ‘Wild ride’ lower for BTC? 5 things to know in Bitcoin this week
The Crypto Fear & Greed Index stood at 19/100 on the day, still indicative of “extreme fear” but nonetheless its highest reading since before the Terra LUNA debacle in May.

As Cointelegraph additionally reported, investment manager ARK Invest revealed that it was still “neutral to positive” on BTC under current circumstances.
Analyzing Bitcoin futures market sentiment, meanwhile, Edris, a contributor to on-chain analytics platform CryptoQuant, voiced caution about making conclusions over any form of recovery.
The taker buy/ sell ratio, which indicates whether buyers or sellers are in control, saw some relief on the day, Edris showed, but the move should be taken with a pinch of salt.
“However, note that it could just be a consolidation or a bullish pullback before another continuation lower,” a blog post read.
“So, many other factors should be considered closely in the coming weeks in order to determine if a bullish reversal or another bull trap could be expected.”

The views and opinions expressed here are solely those of the author and do not necessarily reflect the views of Cointelegraph.com. Every investment and trading move involves risk, you should conduct your own research when making a decision.


