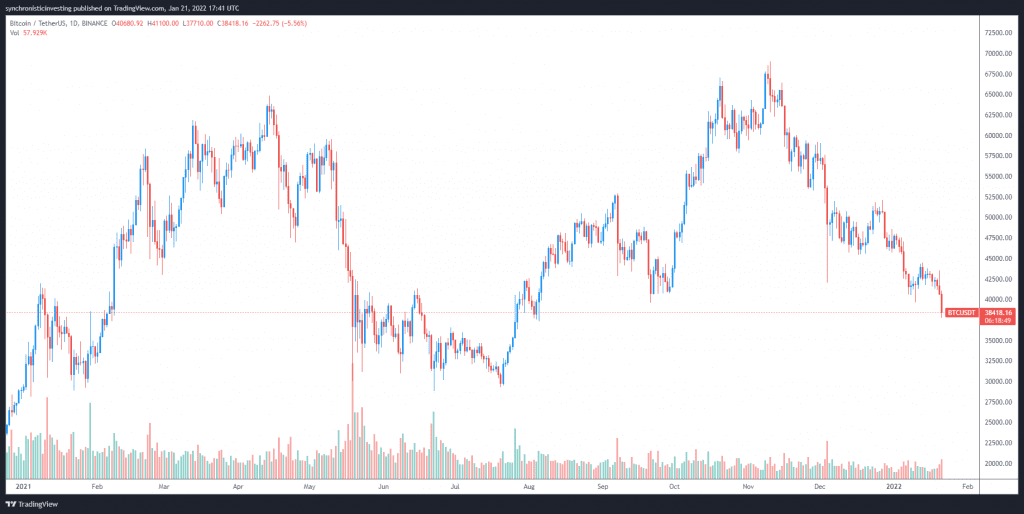
Bitcoin (BTC) price continues to sell-off and the knock-on effect is an even sharper correction in altcoins and DeFi tokens. At the time of writing, BTC price has sank to its lowest level in 6 months and most analysts are not optimistic about an immediate turn around.
Data from Cointelegraph Markets Pro and TradingView shows that a wave of selling that began late in the day on Jan. 20 continued into midday on Friday when BTC hit a low of $36,600.
Here’s a check-in with what analysts have to say about the current downturn and what may be in store for the coming weeks.
Traders expect consolidation between $38,000 and $43,000
The sudden price drop in BTC has many crypto traders predicting various dire outcomes along the lines of an extended bear market. Others like independent market analyst ‘Rekt Capital’, are not so quick to jump the gun and declare that all is lost.
As shown in the following chart posted by Rekt Capital, “the recent BTC rejection means that BTC is now residing at the lower region of its current $38,000-$43,100 range.”

According to Rekt Capital, “Bitcoin is just consolidating inside the $38,000-$43,100 range,” but needs to hold this support level to avoid dropping down into a lower consolidation range.
Rekt Capital said,
“Technically, the $38,000 support area is what separates BTC from entering the $28,000-$38,000 consolidation range. Bitcoin last consolidated in said range in Q1 and Q2 of 2021.”
Head and shoulders pattern confirmed
Analysis of the BTC price action from a purely technical point of view was touched on by David Lifchitz, managing partner and chief investment officer at ExoAlpha, who pointed out that the “giant head and shoulders pattern for BTC is now completed with the neckline broken with BTC at $38,300.”

From a theoretical standpoint, Lifchitz noted that this pattern predicts a possible drawdown as low as $20,000, but he stated that the “fall has generally been less than that” and suggested that “the $31,000 region could definitely be in sight.”
From a fundamental point of view, Lifchitz noted multiple factors that are creating headwinds for BTC, including tightening from the U.S. Federal Reserve, chatter from the EU regulators looking to ban proof-of-work mining, profit-taking from late 2021 and the continued uncertainty about the economic future as it relates to the Covid pandemic.
Lifchitz said,
“Therefore for Bitcoin, a move down to the low-mid $30,000 could be definitely in the cards soon before real dip-buyers show up.”
Traders look to scoop up BTC at $30,000
A look at how traders have responded to this drawdown as compared to the pullback in June of 2021 was provided by analyst and Cointelegraph contributor Michaël van de Poppe, who posted the following chart highlighting the major support zones for each period of weakness.

van de Poppe said,
“Back in June → People are waiting for $23,000 to $25,000 to buy. Right now → People are waiting for $30,000 to buy. Similar fake breakout on the upside to nuke afterward into support.”
A similar point of view was offered by trader and pseudonymous Twitter user ‘Fomocap’, who posted the following chart outlining how BTC could perform in the days ahead.

Fomocap said,
“Relief bounce to $44,000 – $42,000 retest, if rejection then $35,000 – $33,000. What do you think?”
Related: Crypto Twitter responds to Bitcoin dump: ‘Ok cool’
Bulls need a close above $39,600
A final bit of insight into was offered by crypto trader Scott Melker, who posted the following chart showing the price breakdown below a key level that must be recovered.

Melker said,
“Bulls looking for a Hail Mary close above $39,600 on the daily. A close below (especially on weekly) is a break in market structure, lower low etc. Bears showing no mercy.”
The overall cryptocurrency market cap now stands at $1.801 trillion and Bitcoin’s dominance rate is 40.4%.
The views and opinions expressed here are solely those of the author and do not necessarily reflect the views of Cointelegraph.com. Every investment and trading move involves risk, you should conduct your own research when making a decision.


