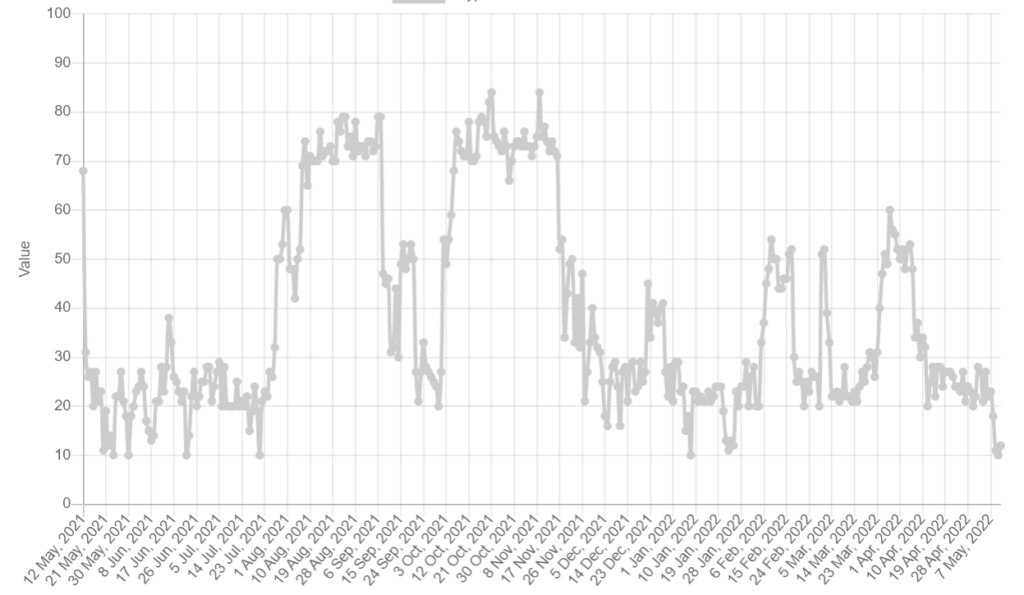
Bitcoin (BTC) price initially bounced from its recent low at $29,000 but the overall market sentiment after a 25% price drop in five days is still largely negative. Currently, the crypto “Fear and Greed index,” which uses volatility, volume, social metrics, Bitcoin dominance, and Google trends data, has plunged to its lowest level since March 2020 and at the moment there appears to be little protecting the market against further downside.
Regulation continues to weigh down the markets
Regulation is still the main threat weighing on markets and it’s clear that investors are taking a risk-off approach to high volatility assets. Earlier this week, during a hearing of the Senate Banking Committee, United States Secretary of the Treasury Janet Yellen called for a regulatory framework on stablecoins and specifically addressed the TerraUSD (UST) stablecoin plunging below $0.70.
Furthermore, the United Kingdom introduced two bills aiming to address crypto regulation on May 10. The Financial Services and Markets Bill and the Economic Crime and Corporate Transparency Bill aim to strengthen the country’s financial services industry, including supporting “the safe adoption of cryptocurrencies.”
Meanwhile, searches for “Bitcoin” and “crypto” on Google are nearing their lowest levels in 17 months.

This indicator could partially explain why Bitcoin is 56% below its $69,000 all-time high because the public interest is low but let’s take a look at how professional traders are positioned in derivatives markets.
Long-to-short data confirms a lack of buyers’ demand
The top traders’ long-to-short net ratio analyzes the positions on the spot, perpetual and futures contracts. From a analysis point-of-view, it gives better understanding on whether professional traders are bullish or bearish.
There are occasional methodological discrepancies between different exchanges, so viewers should monitor changes instead of absolute figures.

According to the long-to-short indicator, Bitcoin might have jumped 4% since the $29,000 low on May 11, but professional traders did not increase their bullish bets. For instance, OKX’s top traders’ ratio decreased from 1.20 to the current 1.00 level.
Moreover, Binance data shows those traders stable near 1.10, and a similar trend happened at Huobi as the top traders’ long-to-short ratio stood at 0.97. Data shows no demand for leverage buys among professional investors despite the 5% price recovery.
CME futures traders are no longer bearish
To further prove that the crypto market structure has deteriorated, traders should analyze the CME’s Bitcoin futures contracts premium. The metric compares longer-term futures contracts and the traditional spot market price.
These fixed-calendar contracts usually trade at a slight premium, indicating that sellers request more money to withhold settlement for longer. As a result, the 1-month futures should trade at a 0.5% to 1% premium in healthy markets, a situation known as contango.
Whenever that indicator fades or turns negative (backwardation), it is an alarming red flag because it indicates that bearish sentiment is present.

The chart above shows how the indicator entered backwardation on May 10 and the move marks the lowest reading in two months at a negative 0.4% premium.
Data shows that institutional traders are below the “neutral” threshold measured by the futures’ basis and this points to the formation of a bearish market structure.
Furthermore, the top traders’ long-to-short data shows a lack of appetite despite the quick 4% price recovery from the $29,000 level and the fact that BTC price now trades near the same level is also concerning. Unless the derivatives metrics show some improvement, the odds of further price correction remain high.
The views and opinions expressed here are solely those of the author and do not necessarily reflect the views of Cointelegraph. Every investment and trading move involves risk. You should conduct your own research when making a decision.


