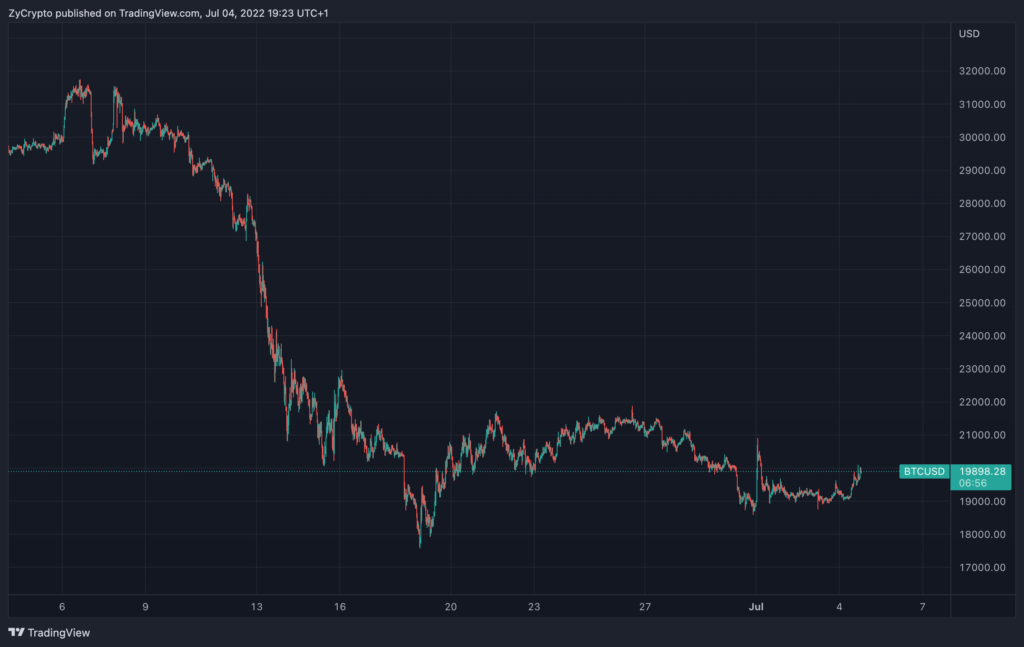
On Monday, Bitcoin continued to display frailty alongside other cryptocurrencies with most volatility being sapped over the weekend ahead of today’s U.S. Independence Day Holiday.
Already, the pioneer cryptocurrency is down by about 75% from its all-time high and roughly 57% in the past 30 days alone. As of writing, BTC is trading at $19,900 after a 3.54% increase in the past 24 hours according to data by CoinGecko.
While it has been hard to pinpoint a reversal zone for BTC at this point, a handful of metrics are signaling that the price is in the process of hammering out a painful floor, although it may be due for another leg down.
Coin Metrics, a resource specializing in crypto data analytics just shared the “Delta Cap” and “Realised Cap” indicators which are now pointing towards Bitcoin finding a possible bottom at $15,000. The delta cap is a hybrid of sorts metric which is calculated as the subtraction of Realized Cap to Average Cap and has successfully been used to spot market bottoms.
As can be seen above, the market has always reversed when the market cap comes between the two indicators. “2018 especially shows that BTC only entered that zone after we got our capitulation crash. In 2014 it was the same, except the bottom was more extended in time.” Coin Metrics wrote.
 
 
In the current situation, BTC has already traded below the realized cap, which could signal incoming strength. However, the firm warned that we could see a further drop with the coming recession. “If we end up getting worse macroeconomic conditions, we could see the price go slightly below the $15k level (delta cap).”
Elsewhere, the MVRV-Z Score has also signaled further capitulation. This indicator measures the difference between Bitcoin’s spot price and what is considered its “fair value.”
As can be seen above, the indicator has accurately nailed every macro bottom in BTC’s history after dropping into the green zone. According to Filbfilb, technical analyst and cofounder of Decentraders, although Bitcoin’s price has entered the green zone, it could drop lower as it steadily carves out a cycle bottom. “This chart is the one for me,” Filbfilb commented about the latest MVRV-Z readings. If previous readings are anything to go by, the pundit sees BTC dropping to $15.6k before a floor can be reached.

That said, there is an indication that Bitcoin has entered the final capitulation phase with indicators such as the relative strength index ‘RSI’ already overstretched in the oversold region. Moreover, asset accumulation in the current phase by retail has also surged which has historically been good for the price. However, sell-offs by BTC whales on minor rallies are keeping prices dormant, Santiment wrote on Monday.


