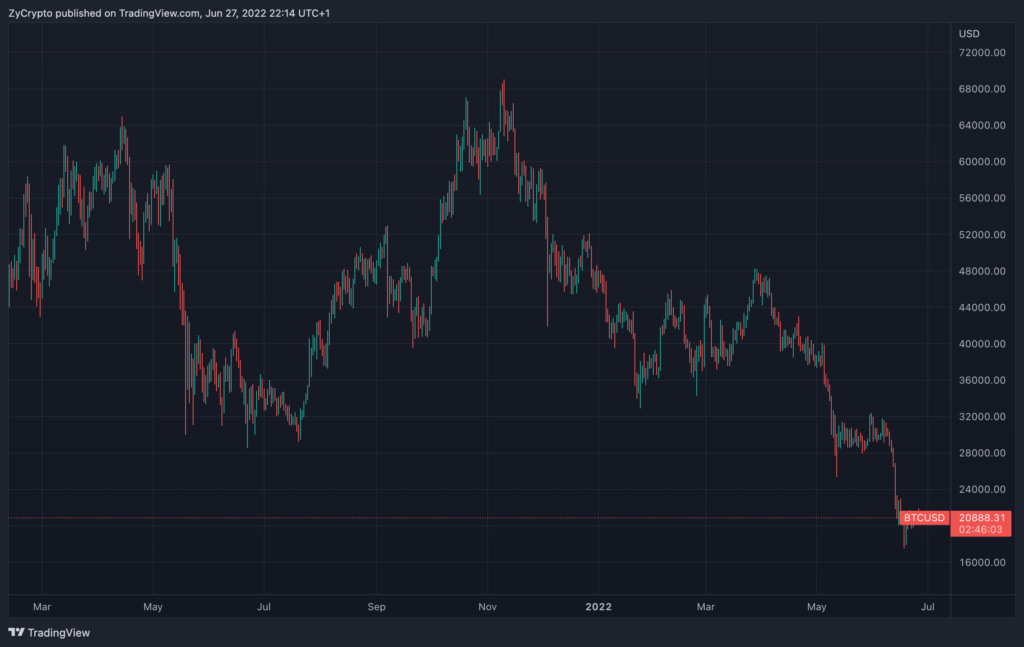
Bitcoin appears to be close to a bottom as revealed by the majority of cyclic indicators including but not limited to Bitcoin’s MVRV Ratio, SOPR Ratio, and Realized Cap-UTXO Age Bands. Data from these indicators reveal a historical pattern that has several times preceded a surging uptrend.
Bitcoin’s MVRV Ratio has a value of 0.9, indicating a price bottom
According to charts from crypto analytics platform, CryptoQuant, the majority of these indicators suggest that Bitcoin is currently undervalued, signaling an imminent rally. The considerable amount of unrealized loss in the bitcoin market also points to the reality that the asset is close to the bottom.
The Bitcoin Puell Multiple – the proportion of the daily issuance of Bitcoin to the annual average – is somewhere around the value of 0.4, indicating a likely bottom for the asset. The Bitcoin Puell Multiple value of 0.4 is the lowest for the coin for over 2 years.
Furthermore, Bitcoin’s MVRV Ratio which indicates the ratio of the asset’s actual market capitalization to the realized capitalization of the asset has the last value of 0.9, another indication of a bottom. Historically, an MVRV Ratio above 3.7 indicates a price top whereas values below 1 show a price bottom.
The last time the MVRV Ratio of Bitcoin reached a value close to this was in March of 2020 when Bitcoin sunk to a price of $4,800 against the dollar from the $8,500 price it started the month with. The asset later went on to end the year with a $28k value after touching that bottom.


Bitcoin’s MPI appears to be on the high side
Additionally, the SOPR Ratio of Bitcoin in terms of Long Term Holders’ SOPR against Short Term Holders’ SOPR currently has a value of 0.6, further attesting to a price bottom. The Net Unrealised Profit and Loss (NUPL) with the last value of -0.05 confirms this attestation.
Conversely, Bitcoin Miners’ Position Index (MPI) appears to be on the high side, suggesting that bitcoin miners are dispensing over what their daily distribution ought to be. This is because miners are seeing less profit for their activities considering the sinking of bitcoin as opposed to the ever-rising utility fees for mining.
Most of these indicators signify a price bottom without any reasonable doubt, and as seen from historical data, the likelihood of an uptrend is close. Bitcoin (BTC) currently trades at a price of $20,918 against the dollar, having gained by 3.79% the past week.


