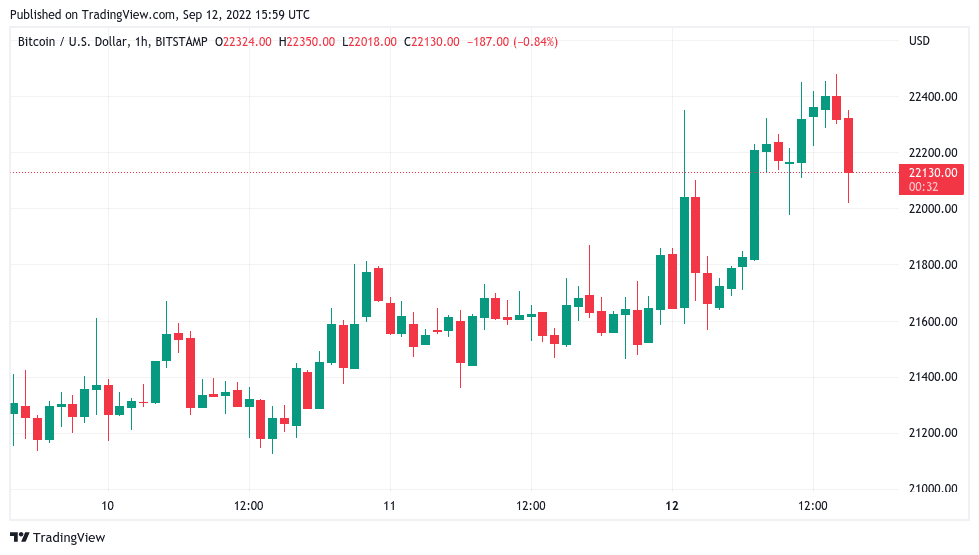
Bitcoin (BTC) kept grinding higher at the Sept. 12 Wall Street open as traders called for an imminent correction.
$23,000 proves essential to flip
Data from Cointelegraph Markets Pro and TradingView showed BTC/USD hitting $22,481 on Bitstamp, its highest since Aug. 19.
The pair had preserved existing gains over the weekend, with a declining U.S. dollar providing a catalyst for risk assets as the week began.
The S&P 500 and Nasdaq Composite Index both traded up 1.1% after the first two hours’ trading. By contrast, the U.S. dollar index (DXY) was down 0.7% on the day.

Analyzing the situation, popular trader Crypto Ed said that the time had now come to eye a corrective move on BTC/USD.
“I would say that all signs are there for some shorts,” he told viewers in his latest YouTube update.
Upside potential was likely limited to $23,000, he suggested, while to the downside, $20,800 was an area of interest.
A CME Bitcoin futures gap left over from the Sept. 10 close, meanwhile, added the area around $21,400 as a possible retracement target.
“I only would be looking for longs if we break $23,000, then for a move towards $28,000–$29,000,” Crypto Ed added.

Equally expecting a trend change was Il Capo of Crypto, who on the day reinforced a conviction that the current price strength was simply a relief rally within an overall bear market.
“Most people getting bullish now. Remember that this is a short squeeze, a bounce that happens during a bear market to continue the downtrend afterwards,” he tweeted.
“I still expect a little bit higher ($22500–$23000), but soon I will turn full bearish again.”
Having sealed a weekly close above its realized price, BTC/USD now looked primed to see a daily candle close above the 100-day moving average (MA) for the first time since April.

Ethereum struggles on Merge countdown
Less inspiring, meanwhile, was price action on Ethere (ETH), which lost ground on the day despite ongoing hype around the Merge.
Related: The Fed, the Merge and $22K BTC — 5 things to know in Bitcoin this week

ETH/USD was down 2.2% at the time of writing, while ETH/BTC caught the attention of some market participants.
Update: Rejection off the 0.085 level for ETH/BTC.
My position that the run-up in ETH going into the merge has no more gas is intact. Will continue watching this. https://t.co/HKPdHmsDrb pic.twitter.com/Xy0J6baaai
— Joe Consorti ⚡ (@JoeConsorti) September 11, 2022
Bitcoin’s share of the overall cryptocurrency market cap thus saw a stiff rebound on the day after hitting just 38.9%, its lowest since January.

The views and opinions expressed here are solely those of the author and do not necessarily reflect the views of Cointelegraph.com. Every investment and trading move involves risk, you should conduct your own research when making a decision.


