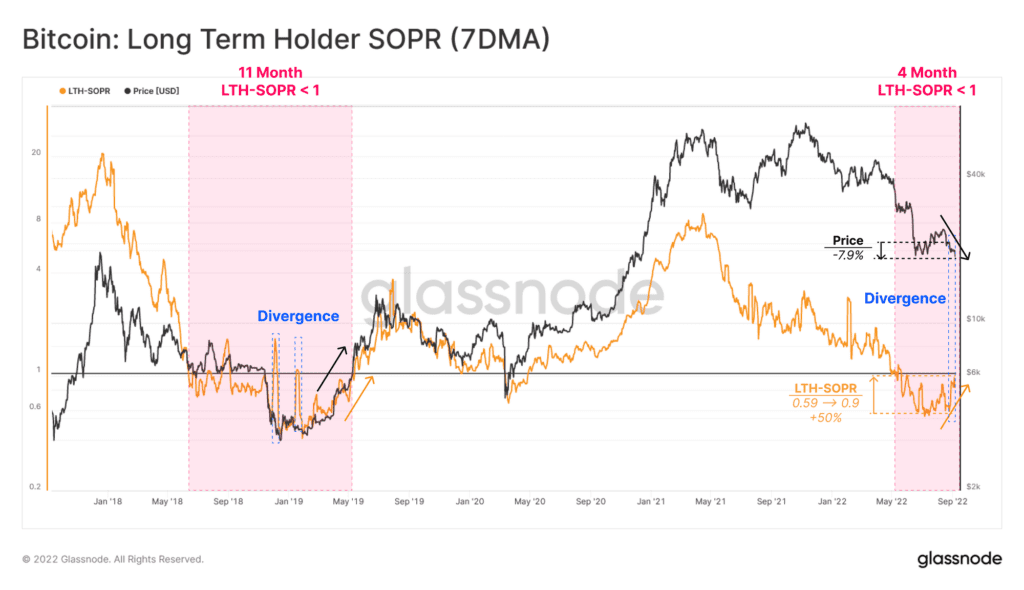
Data shows the Bitcoin long-term holders have been selling their coins at a loss for a period of four months now.
Bitcoin Long-Term Holder SOPR Has Remained Below 1 Recently
As per the latest weekly report from Glassnode, the BTC long-term holders have continued to sell at a loss in recent weeks.
The relevant indicator here is the “Spent Output Profit Ratio,” which tells us whether investors in the Bitcoin market are moving their coins at a loss or at a profit.
When the value of this metric is greater than one, it means the average holder is moving coins at a profit right now.
On the other hand, the value of the indicator being less than the threshold suggests the overall market is realizing some loss at the moment.
A cohort in the BTC market is the “long-term holder” (LTH) group, which includes all those investors who held their coins for at least 155 days without selling or moving them.
Now, here is a chart that shows the trend in the Bitcoin SOPR over the last few years specifically for the LTHs:
The value of the metric seems to have been trending up in recent days | Source: Glassnode's The Week Onchain - Week 37, 2022
As you can see in the above graph, the 7-day moving average Bitcoin long-term holder SOPR has been under a value of 1 for around four months now. This implies that these LTHs have been realizing loss during this period.
Back in the 2018-19 bear market, the indicator stayed in this region for about eleven months, with the exception of a few sudden spikes.
These abrupt breaks into the green region were caused by movement of a large amount of older BTC supply (which generally holds a significant amount of profit).
Historically, a proper break of the metric into values greater than one has lead to a transition back into bullish momentum for Bitcoin.
Recently, the LTH SOPR has been steadily climbing up, and it is now approaching the break-even mark. Currently, it’s unclear whether the indicator will keep going and cross this line, or if it would stay in the region below for months yet, similar to the previous bear market.
BTC Price
At the time of writing, Bitcoin’s price floats around $21.3k, up 8% in the last week. Over the past month, the crypto has lost 12% in value.
The below chart shows the trend in the price of the coin over the last five days.

Looks like the value of the crypto has plunged down today | Source: BTCUSD on TradingView
Featured image from Kanchanara on Unsplash.com, charts from TradingView.com, Glassnode.com


