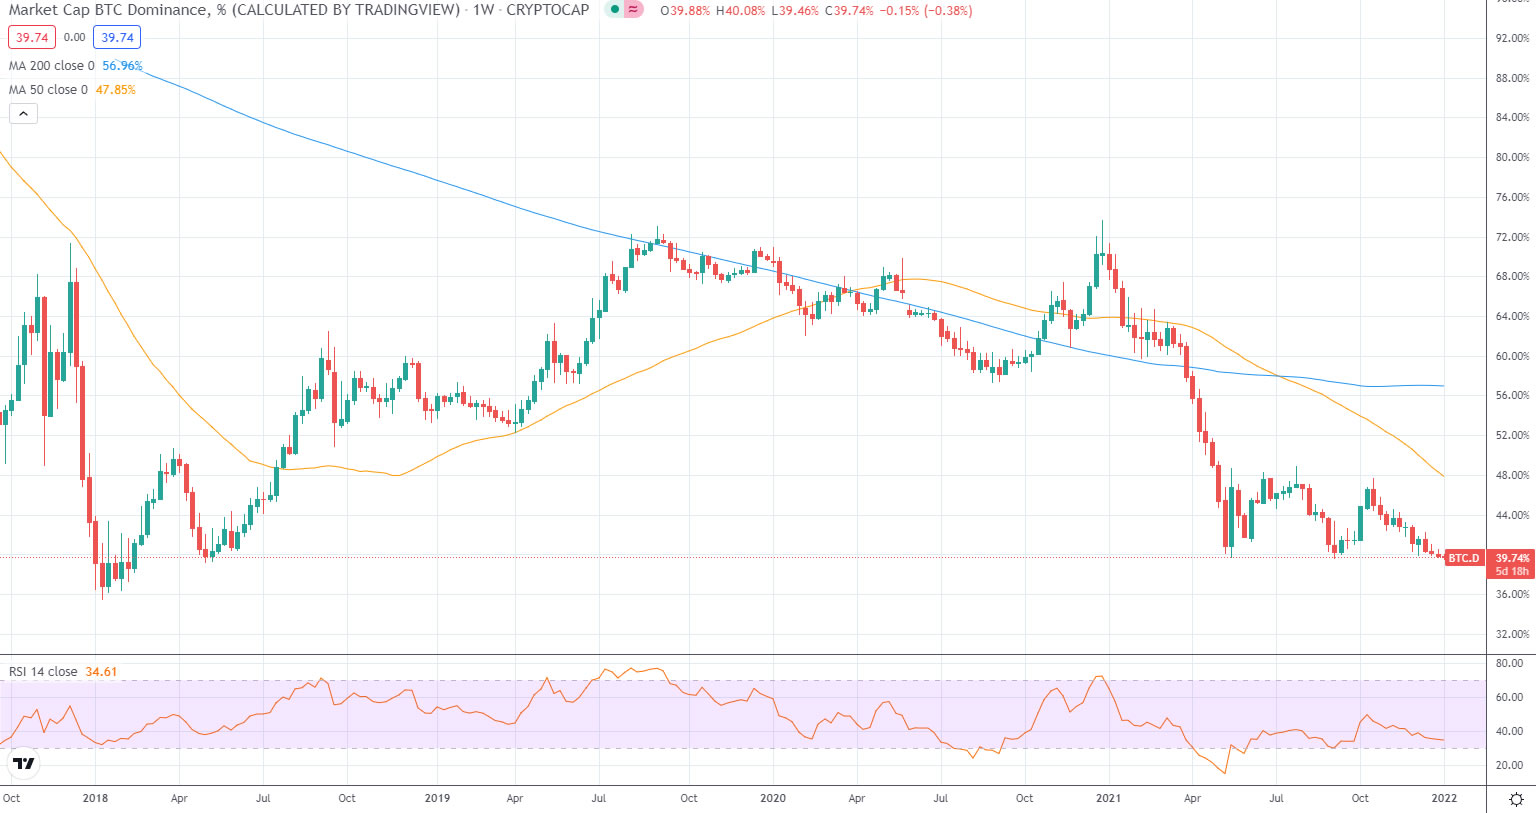
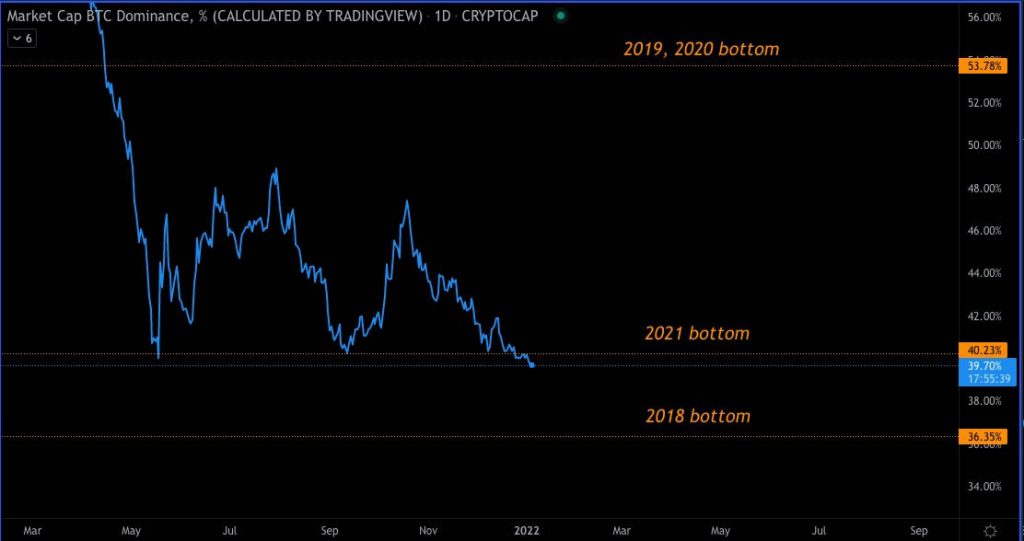
The Bitcoin dominance indicator has fallen to its lowest level for more than three years as it continues to retreat from last year’s epic all-time high.
Bitcoin market dominance has just dipped below its 2021 low and is currently at 39.73% according to TradingView. The move was noted by Spartan Group’s Jason Choi who tweeted the chart on Jan 4.
It is a stark contrast to the dominance Bitcoin had over markets at the same time last year when it was around when it topped 73.6% on Jan 3, 2021. Since then it has declined 46% to current levels.
Lowest Bitcoin dominance value since 2018
According to TradingView, BTC dominance fell to 39.48% on Jan 3. It has not been that low since May 2018 when it dropped to around 39.18%. In September 2021, BTC dominance dropped back below 40% before recovering and falling again in the latter half of the year.
The lowest this value has ever been was on Jan 11, 2018, when it fell to around 35.5% following the first major altcoin surge.

A plunge in BTC dominance is usually a signal that altcoins will start to rally, but they too are in decline at the moment, just at a slower rate.
Ethereum’s market share has been climbing steadily since January 2020 and it is currently 20.23% according to TradingView. ETH dominance hit a local high of 22.35% in early December but has retreated some since.
BTC and ETH combined constitute around 60% of the total crypto market which is less than Bitcoin’s share was in March 2021.
Apart from altcoins, stablecoins collectively occupy 7.15% of the total crypto market capitalization according to CoinGecko. High cap altcoins such as Binance Coin (BNB), Solana (SOL), and Cardano (ADA) have also increased their shares with 3.67%, 2.22%, and 1.80% respectively.
Bitcoin price outlook
BTC has continued to decline over the past 24 hours, dropping another percentage point to trade at $46,430 at the time of press. It has lost 8.4% over the past week and is currently trading down 32.7% from its Nov 10 all-time high.
Bitcoin is trading at the lower limit of its range-bound channel and is below the 200-day moving average suggesting that another decline is imminent. The next level of support from current prices is around $45,000.
Disclaimer
All the information contained on our website is published in good faith and for general information purposes only. Any action the reader takes upon the information found on our website is strictly at their own risk.


