Bitcoin’s (BTC) price looks exhausted after testing the $45,000 mark on Tuesday. The U.S Consumer Price Index (CPI), rose to 7.5% on a yearly basis in January 7% beating the market expectation of 7.3%. As a result, the US Dollar Index (DXY) firmly trades above the 95.0 level.
- Bitcoin (BTC) price consolidates near $45K on Thursday.
- The price soared 38% from the January lows of $32,933.3.
- BTC hovers above 50 SMA still advocating for the current uptrend continuation.
BTC retreated from the higher levels in initial reaction to the US CPI data. As of writing, BTC/USD is trading at $43,362.67, down 2.33% for the day. The current market cap stands at $822,735,328,002 as per the CoinmarketCap.
US-based independent research firm Fsinsight reported that Bitcoin could rise by almost 500% and could test $200,000 in the second half of the year.
Is correction on cards!
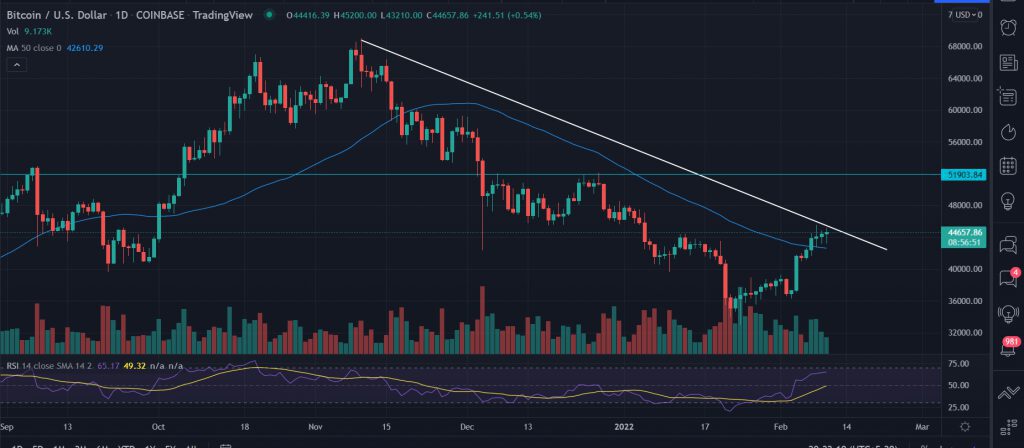
On the daily chart, Bitcoin’s (BTC) price has seen a remarkable recovery from the lows made on January 24 at $32,933.33. However, investors are a bit exhausted near the descending trend line from the highs of $69,000. Moving further, the formation of the consecutive ‘Doji’ candlesticks near the highs indicates indecision among buyers.
BTC taking some positive clues from the placement of the 50 SMA (Simple Moving Average) at $42,674.90.
The Daily Relative Strength Index (RSI) holds near 64, still far from the overbought zone indicating that the market still has the scope of further upside reaction.
A sustained buying pressure would breach the bearish slopping line while aiming for $48,000. Next market participants will try to take out the $52,000 horizontal resistance line.
On the other hand, if the price breaks below the 50-SMA then sellers could test the psychological $40,000 level followed by the low of February 3 at $36,259.01.


