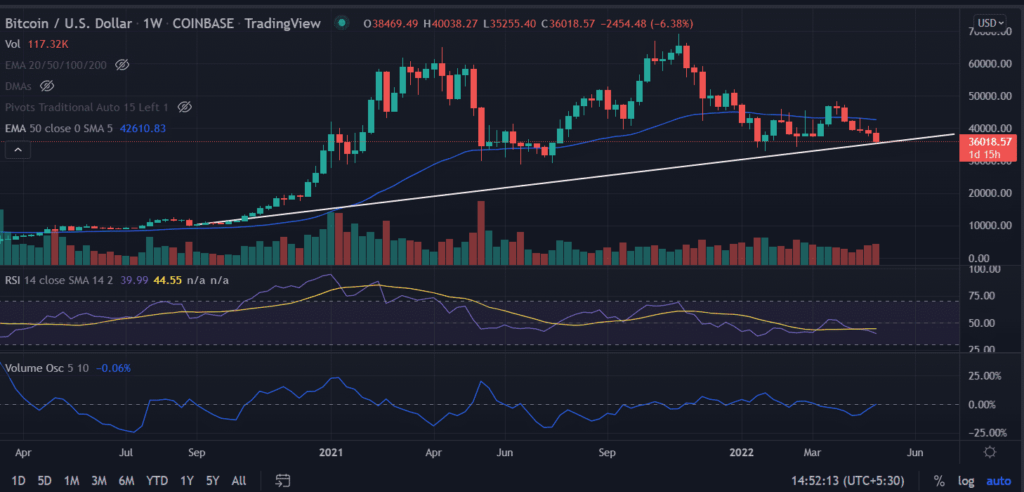
BTC price traded with a cautious tone as the sell-off cools off on Saturday. It seems the sellers look exhausted, as the price manages to reclaim $36,000. In a broader crypto market selling spree, ETH is down nearly 6% as compared to a decline of 8% in BTC.
- BTC sell-off stabilizes and trades flat on Saturday; locks 8% losses on weekly basis.
- More downside is expected in the price breaks below $35,000 this week.
- A bounce-back looks diminished as the sell-side volume deepens.
As of publication time, BTC/USD is exchanging hands at $35,979.07, down 0.08% for the day. According to the Coinmarketcap, the pioneer crypto coin is sustaining a 24-hour trading volume of $34,647,973,885.
BTC price struggles to hold the support zone
On the weekly chart, the BTC price is under the medium-term downtrend, although since the beginning of the New Year it consolidate in a short-term trading range of $48,000 and $36,000, with few hiccups in between. In addition to that, the 50-day ema (Exponential Moving Average) plays a crucial role in deciding the trend for investors.
In July BTC pierced the moving average and recorded a jump toward record highs. Further, as soon the price sliced 50-day ema, it tested swing lows extending from $32,000 to $35,000.
Trending Stories
The breakage of the bullish slopping line would invalidate any bullish argument for the asset so far. A weekly close below $35, 0000 would trigger a key level to amplify selling towards $26,000.
advertisement
On the flip side, Now as we can see the formation of higher lows since the week ended on July 19 suggests it could be the time for a technical bounce back. If that comes true then BTC price would attempt to take out the $42,000 in the coming few sessions if not immediately.
Technical indicator:
RSI: The relative strength index (RSI) trades below-average line at 37.47, which indicates an extension of a downswing in the price.
Volume oscillator: The upside tick rules out in the favor of bears.


