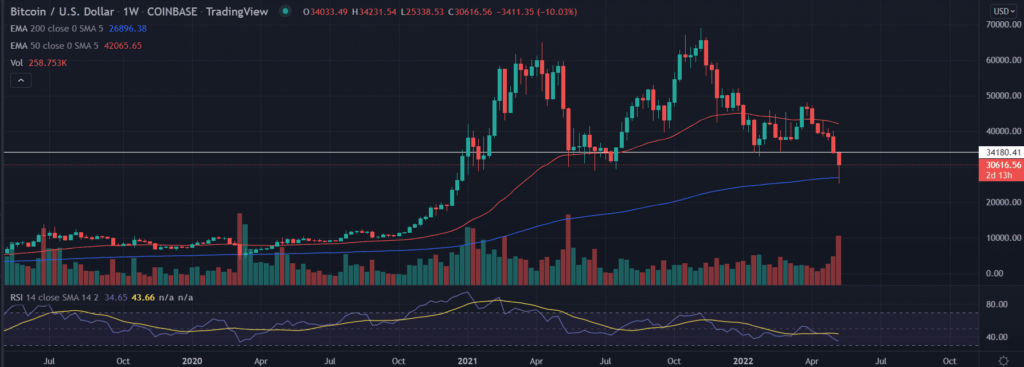
BTC price action exhibits a framework that hints at a possible upward movement. The price opened lower but quickly recovered to the session’s high. BTC tagged the $30k mark after days of downside moment. The current price action hints at a recovery rally although downside risk remains intact.
- BTC’s price manages to rebound from the swing lows of around $25K.
- Still, the price remains under downward pressure as the trading volume diverges.
- The Fear & Greed Index holds at extreme fear levels, at 10.
As of publication time, BTC/USD reads at $30,440.22, up 5.13% for the day. The 24-hour trading volume of the digital asset holds at $53,023,093,119 with a loss of 41%.
BTC price shows a recovery sign
BTC price indicates that the pioneer cryptocurrency has the potential to rise from the current levels. As the May series began, BTC’s price lost 36% from the highs of $39,864.55 made on May 5. The massive downswing is the consequence as it sliced the short-term support base extending from $32,000 to $34,000 on the daily chart. However, amid the oversold market structure, there is a fair chance of a recovery in the weekly time frame.
On the weekly chart, the BTC price tested the critical 200-day EMA (Exponential Moving Average) at $26,895.01. This level acted as a strong upside barrier for it with the formation of a ‘hammer’ candlestick. Still, a sustained buying pressure would be required to push the price to pierce and tag the horizontal $34,000 mark.
An acceptance above $34,000 would ask for $42,000, above another crucial moving average, 50-day EMA.
Trending Stories
On the contrary, a fall below the session’s low would evaporate any bullish hopes. In addition to that, a daily candlestick below $25,000 would open the gates for further lower levels, $18,000 last seen in October.
Technical indicator:
RSI: The daily relative strength index trades below the average line near to the oversold zone. It reads at 31 with a negative bias.


