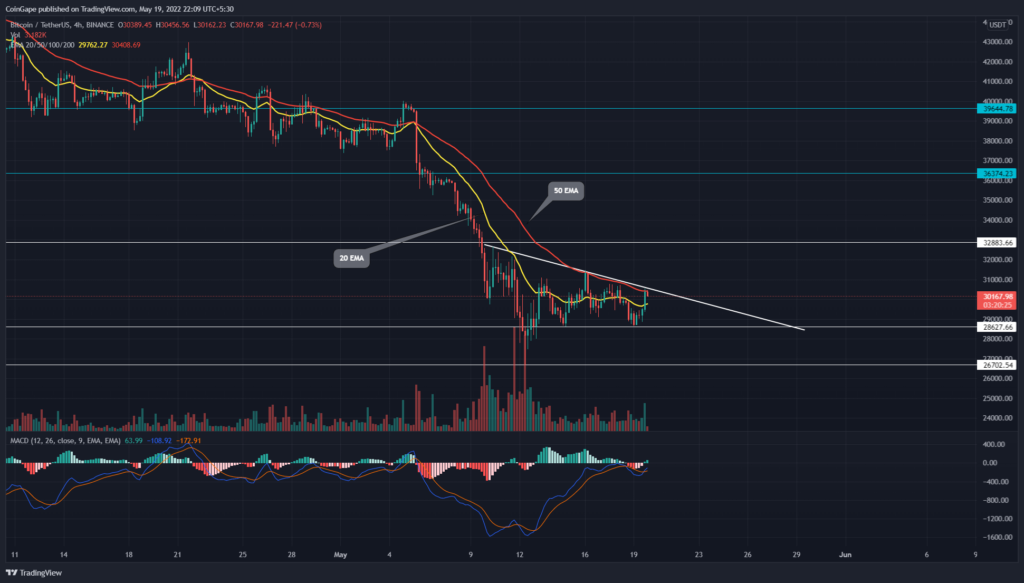
The Bitcoin(BTC) price retest of the overhead resistance trendline teases a breakout entry for interested buyers. However, 50 EMA offering constant resistance to the price action may interrupt the potential rally.
Key points:
- The BTC price consolidates rally over the last few days
- The BTC price bullish breakout to overhead resistance
- The intraday trading volume in the Bitcoin is $27.3 Billion, indicating a 3.2% gain
Source- Tradingview
The early May sell-off in the largest cryptocurrency-Bitcoin breached some significant psychological levels such as $35000 and $30000. As a result, the extended correction slumped the price to a new lower low of $27600.
However, the BTC price started to coil up above the fresh low and initiated a consolidation phase. As a result, this range-rally getting hammered from a descending trendline shows lower higher formation in the 4-hour time frame chart.
On May 14th, the BTC price rebounded from the $26800 support twice within a week, suggesting an accumulation zone for buyers. Furthermore, the coin price is 5% up today and attempts to reclaim $30000.
Trending Stories
A potential breakout from the resistance trendline would drive the coin price $50 higher to $10 high to $33000
advertisement
However, the aligned resistance of the descending trendline and 50 EMA may undermine the recovery rally.
Technical indicator-
The 50 EMA aligned with the descending trendline accentuates the weightage of the overhead resistance. Moreover, a bearish sequence of these EMAs keeps the sellers in charge.
Despite a sideways rally in price action, a significant bullish divergence in MACD and line suggest growth in underlying bullishness. Moreover, a recent bullish crossover among these lines gives an additional boost to long trades.
- Resistance level- $35000, and $40000
- Support level- $33000 and $30000


