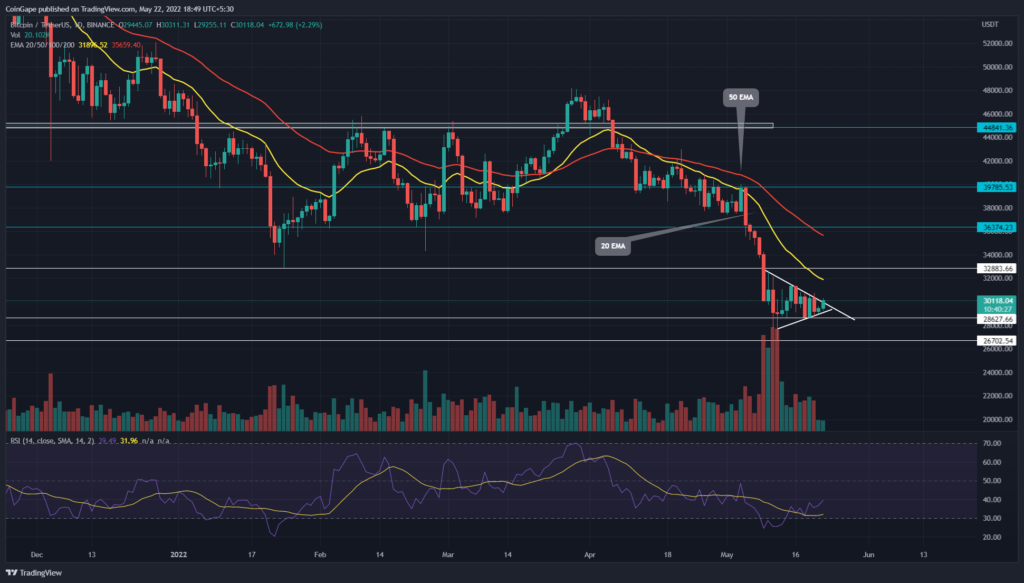
The Bitcoin(BTC) traders’ tug of war around the $30000 adds uncertainty to the market. Moreover, this consolidation forms a symmetrical triangle pattern, reflecting a potential rally for BTC. However, can buyers undermine the multiple resistances waiting ahead?
Key points:
- The BTC price shows eight consecutive red candles in the weekly time frame chart
- The rising RSI slope hints at a bullish breakout from the symmetrical triangle
- The intraday trading volume in the Bitcoin is $16.88 Billion, indicating a 40% loss
Source-Tradingview
On April 22nd, the Bitcoin(BTC) price broke down from a long-coming support trendline, signaling the resumption of the prevailing downtrend. However, the sellers took nearly a week to sustain the price below the $40000 mark.
Furthermore, the buyers eventually submitted to the rising selling momentum and took the downtrend to its current lower low of $26350. The recent sell-off had sliced through several support levels such as $33000 and $30000.
However, the BTC price has been wobbling around the $30000 mark for the past two weeks, projects the formation of a symmetrical triangle pattern. As a result, the coin price is gradually narrowing within the triangle suggesting an upcoming breakout.
Trending Stories
Therefore, if buyers could breach the overhead resistance, the BTC price would drive 32% high to $40000.
advertisement
Conversely, a daily candle closing below $26000 would extend the correction rally to the next significant support at$27600.
Technical indicator-
While the Bitcoin price presents a sideways rally, the RSI slope trending higher indicates a rise in the underline bullishness. Therefore, A bullish divergence promotes an upside breakout from the triangle pattern.
The wide gap between the bearishly aligned VI+ and V- gets narrower, suggesting the buyers attempt to wrest control from sellers. A potential bullish crossover would give additional confirmation to long traders.
- Resistance level- $35000, and $40000
- Support level- $28600 and $267000


