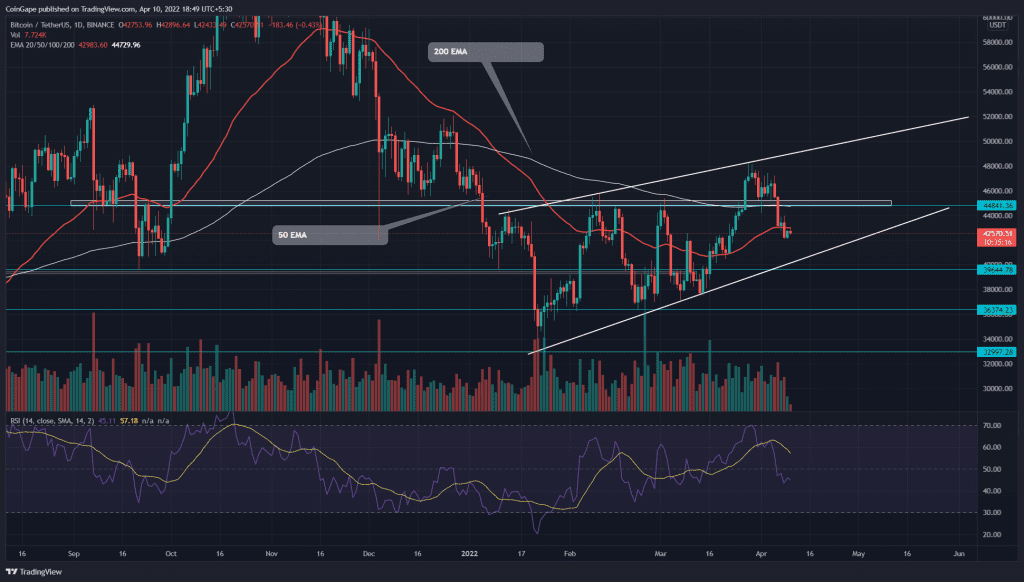
The recent fallout from the $45000 resistance may have trapped the aggressive buyers who bought the breakout trade. The Bitcoin(BTC) price currently trades at the $42645 mark and teases a weekly candle closing below $45000. However, the coin chart reveals a rising wedge pattern which may prevent any excess loss in this correction.
Key points:
- The BTC price forms an evening star candle in the weekly time frame chart
- The coin price resonates in a rising wedge pattern
- The intraday trading volume in the Bitcoin is $24.2 Billion, indicating a 32.6% lost
Source- Tradingview
After spending the last quarter in an accumulation phase, the Bitcoin(BTC) price made a decisive breakthrough from the $45000 resistance. On March 24th, the coin price provided a weekly candle-closing above this resistance, suggesting the buyers intend to surge higher.
However, the bulls failed to sustain this breakout, allowing sellers to pull the price back below the breached resistance. As a result, the traders who entered above the $45000 level may liquidate their holding and accelerate the selling momentum.
Furthermore, the traders can expect a bearish retest to the old $45000 resistance for the upcoming week. This retest may validate the seller’s commitment to a further price decline.
The technical chart shows the BTC traders responding to a rising wedge pattern, and the current retracement phase is just a pullback to the support trendline. Moreover, the $40000 support aligned with the ascending trendline may provide strong support for bullish continuation.
- Resistance level- $48150, $52000
- Support level- $36400, $36400
Technical indicator-
The flattish 100 and 200-day EMAs suggest a sideways movement for BTC. However, the coin price trading below these crucial EAMs indicates the sellers at a better advantage.
The Relative Strength Index(45) slope nosedived below the neutral line suggested a negative sentiment among traders.


