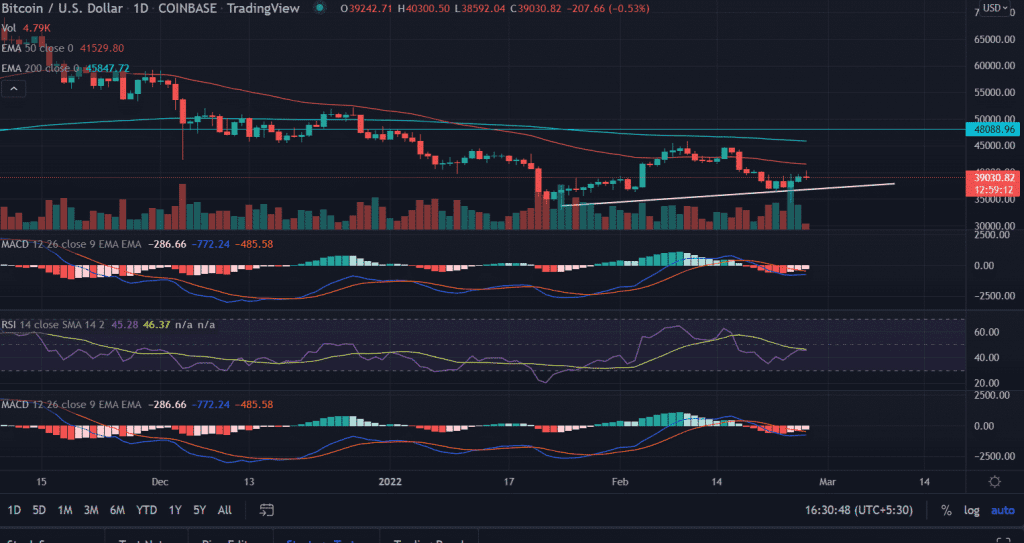
Bitcoin (BTC) price trades with mild losses on Saturday. The price opened lower but quickly reverses the action and touched the day’s high at $40,300 after six days. However, the rally fizzled out quickly as BTC retraced back to $39,000. Thus the price is moving sideways with no meaningful price action.
- Bitcoin (BTC) price tracks lower on Saturday.
- Expect an upside of 26% if the price closes above $40k.
- Momentum oscillators warn of any aggressive bids.
In the recent development of the Russia-Ukrain war, Russian President Vladimir Putin has been reported to offer a high-level negotiation talk with Ukraine as he told to his Chinese counterpart Xi Jinping. On Friday, Nasdaq rose 1.64%, Dow Jones ended higher with 2.51%, and S&P 500 gained 2.24%.
As of press time, BTC/USD is trading at $39,024.07, down 0.58% for the day. The world’s largest and most famous currency held the 24-hour trading volume at $25,591,014,322.26 with a loss of 30%.
BTC price looks for bullish reversal
On the daily chart, Bitcoin (BTC) price after losing nearly 65% from the record highs made in November at $69,000, the price is looking to form a base in pursuit of another 26% upside from the current levels.
The ascending trend line from the lows of $32,933.33 acts as reliable support for BTC bulls. BTC retraced almost 35$ after making swing highs at $45,855. As this time BTC meets the buyers near $34,322 signaling bulls making a comeback and could push the asset back to the upside territory.
A daily close above the psychological $40,000 level would first capture the highs made on February 17 at $44,195.62 followed by a $48,000 horizontal line.
On the flip side, BTC still trades below the crucial 50-day and 200-day EMAs (Exponential Moving Average) at $41,529 and $45,847.64 respectively. Further, a failure to hold the session’s low could test the bullish slopping line at $36,220.
Technical indicators:
RSI: The Daily Relative Strength Index (RSI) reads at 46 with a neutral bias.
MACD: The Moving Average Convergence Divergence (MACD) hovers below the midline receding bearish momentum.


