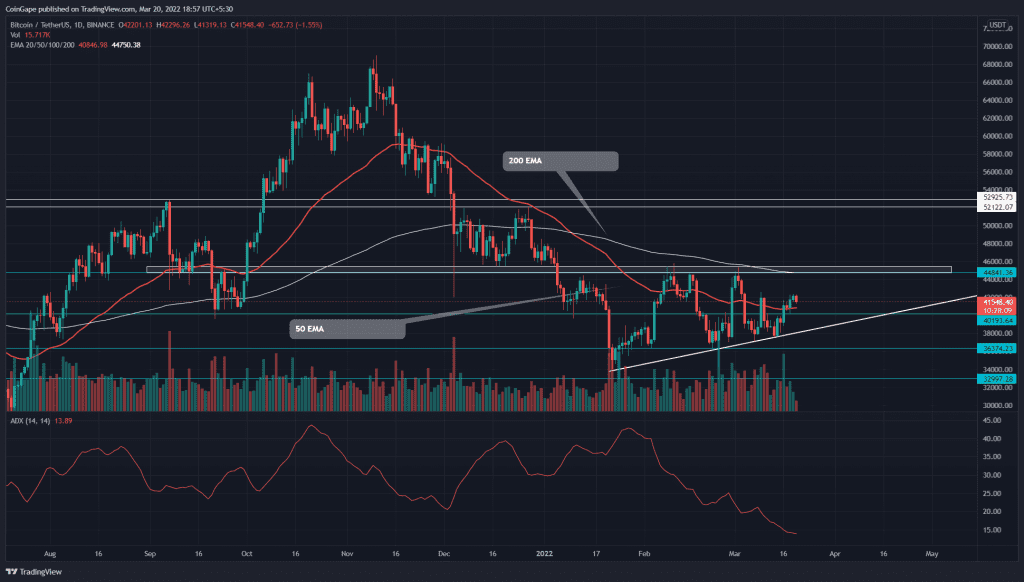
The Bitcoin price has been in a state of tumult for the past two months. The price action respects the $45000 stiff resistance and the ascending trendline displays an ascending triangle formation. The bullish pattern could lead the BTC price beyond the $45000 mark.
Key points
- The BTC price nearing its fifth retest to $45000 resistance over the last 2 months
- The 20-and-50-day EMA soon to provide a bullish crossover
- The intraday trading volume in Bitcoin is $21.1 Billion, indicating a 16.5% loss
Source- Tradingview
The recent bull cycle from the rising trendline has pushed the BTC/USDT pair above the $40000 mark. This week the coin price has registered a 10% gain, trying to sustain above the breached resistance.
Today, the coin displayed a 1.63% loss by the press time and reverted back to $40000. The post-retest rally could drive the BTC price to $45000 mark, suggesting another 9% gain. If buyers could breach this monthly support, the investors can expect coin price to hit the $52100 mark.
Conversely, a bearish reversal from the local resistance($45000) would dump the BTC price back to the support trendline, indicating the traders need more buying pressure to overcome this resistance.
Technical indicator-
The presence of 200-day EMA at the $45000 mark strengthens the seller’s defense. However, the rising 20-day EMA is poised to cross above the 50-day EMA, bolstering the ongoing rally.
The ADX slope has significantly dropped due to this short-term consolidation, indicating the diminishing bearish momentum.
Bitcoin On chain metric- Global In/Out of the Money(GIOM)

The featured image displays that 65.6% of Bitcoin addresses(In The Money) are in profit, conversely 28.62% of addresses(Out of the Money) are in loss.
With respect to BTC spot price($41590), the nearest red cluster suggests a minor resistance at $43944, followed by a huge cluster with the mean value of $47643.
On the other hand, the In the Money-green cluster indicates the nearest support at $38866.


